
















©The Author(s) 2025.
World J Stem Cells. Dec 26, 2025; 17(12): 110894
Published online Dec 26, 2025. doi: 10.4252/wjsc.v17.i12.110894
Published online Dec 26, 2025. doi: 10.4252/wjsc.v17.i12.110894
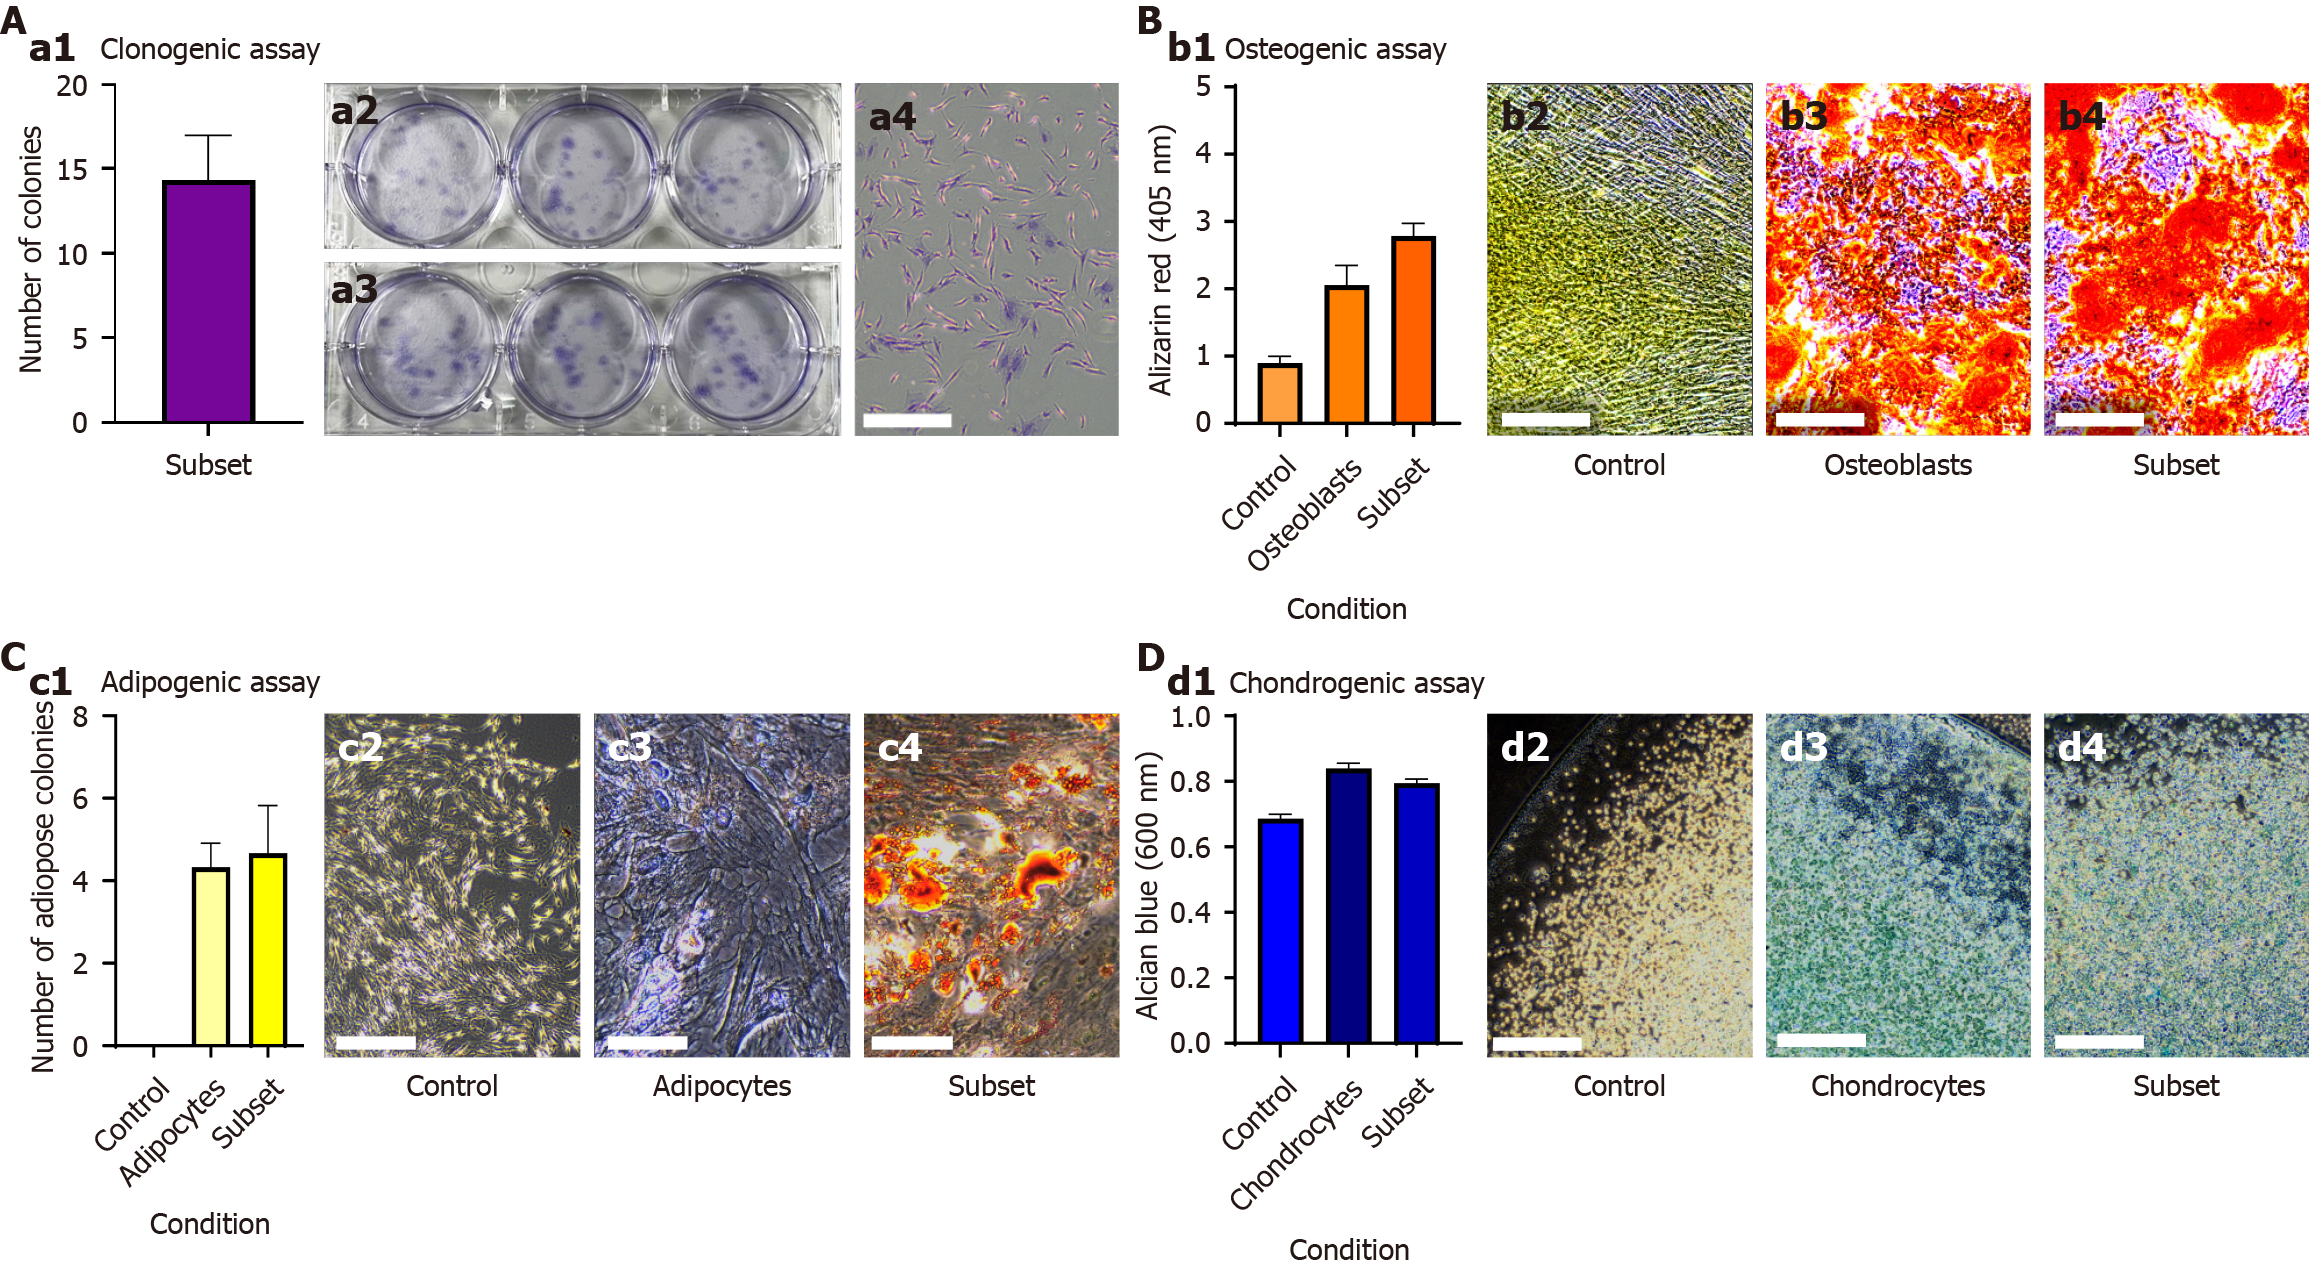
Figure 3 CD45-CD73+CD39+ cell subset displays mesenchymal stem cell characteristics.
A: Clonogenicity of CD45-CD73+CD39+ isolated mesenchymal stem cells (MSCs). Cells were plated at 100 cells/well in a 6 well plate. After 14 days cells were stained with crystal violet. Aggregates of ≥ 50 cells were defined as colonies (a1). The bar graph represents the average number of colonies. Results are mean ± SD (n = 2). Representative image of one colony at day 14 following fixation and crystal violet staining at 40 × and scale bar = 24 μm (a1-a3); B: Each bar graph represents treatment group mean ± SD (n = 3), P < 0.0001, MSC subset compared to negative control. CD45-CD73+CD39+ subset was cultured at 10000 cells/well and treated with osteogenic differentiation medium. On day 21, cells were fixed and stained with alizarin red. Untreated cells and osteoblasts were used as controls (b1). Representative images of untreated subset, osteoblast, treated subset at day 21 following fixative and stain at 40 × and scale bar = 24 μm (b2-b4). Following imaging, cells were measured for absorbance at 405 nm; C: Each bar graph represents treatment group mean ± SD (n = 3), P < 0.001, MSC subset compared to negative control. CD45-CD73+CD39+ subset was cultured at 100 cells/well and treated with adipogenic differentiation medium. On day 28, cells were fixed and stained with Oil Red O. Aggregates of ≥ 50 cells and vacuoles were defined as adipogenic colonies. Untreated cells and adipocytes were used as controls (c1). Representative images of untreated subset, adipocytes, treated subset at day 28 following fixative and stain at 40 × and scale bar = 24 μm (c2-c4); D: Each bar graph represents treatment group mean ± SD (n = 3), P < 0.001, MSC subset compared to negative control. Cells were plated in micromasses in a 6 well plate at density of 250000 cells/ well. After 7 days, cells were fixed and stained with Alcian blue (d1). Representative images of untreated subset, chondrocyte, treated subset at 7 days following fixative and stain at 40 × and scale bar = 24 μm (d2-d4). Cells were measured for absorbance at 600 nm.
- Citation: Martin K, Gullo F. Isolation and characterization of CD73+CD39+CD146+ mesenchymal stem cell subset from bone marrow. World J Stem Cells 2025; 17(12): 110894
- URL: https://www.wjgnet.com/1948-0210/full/v17/i12/110894.htm
- DOI: https://dx.doi.org/10.4252/wjsc.v17.i12.110894