
















©The Author(s) 2025.
World J Stem Cells. Dec 26, 2025; 17(12): 110564
Published online Dec 26, 2025. doi: 10.4252/wjsc.v17.i12.110564
Published online Dec 26, 2025. doi: 10.4252/wjsc.v17.i12.110564
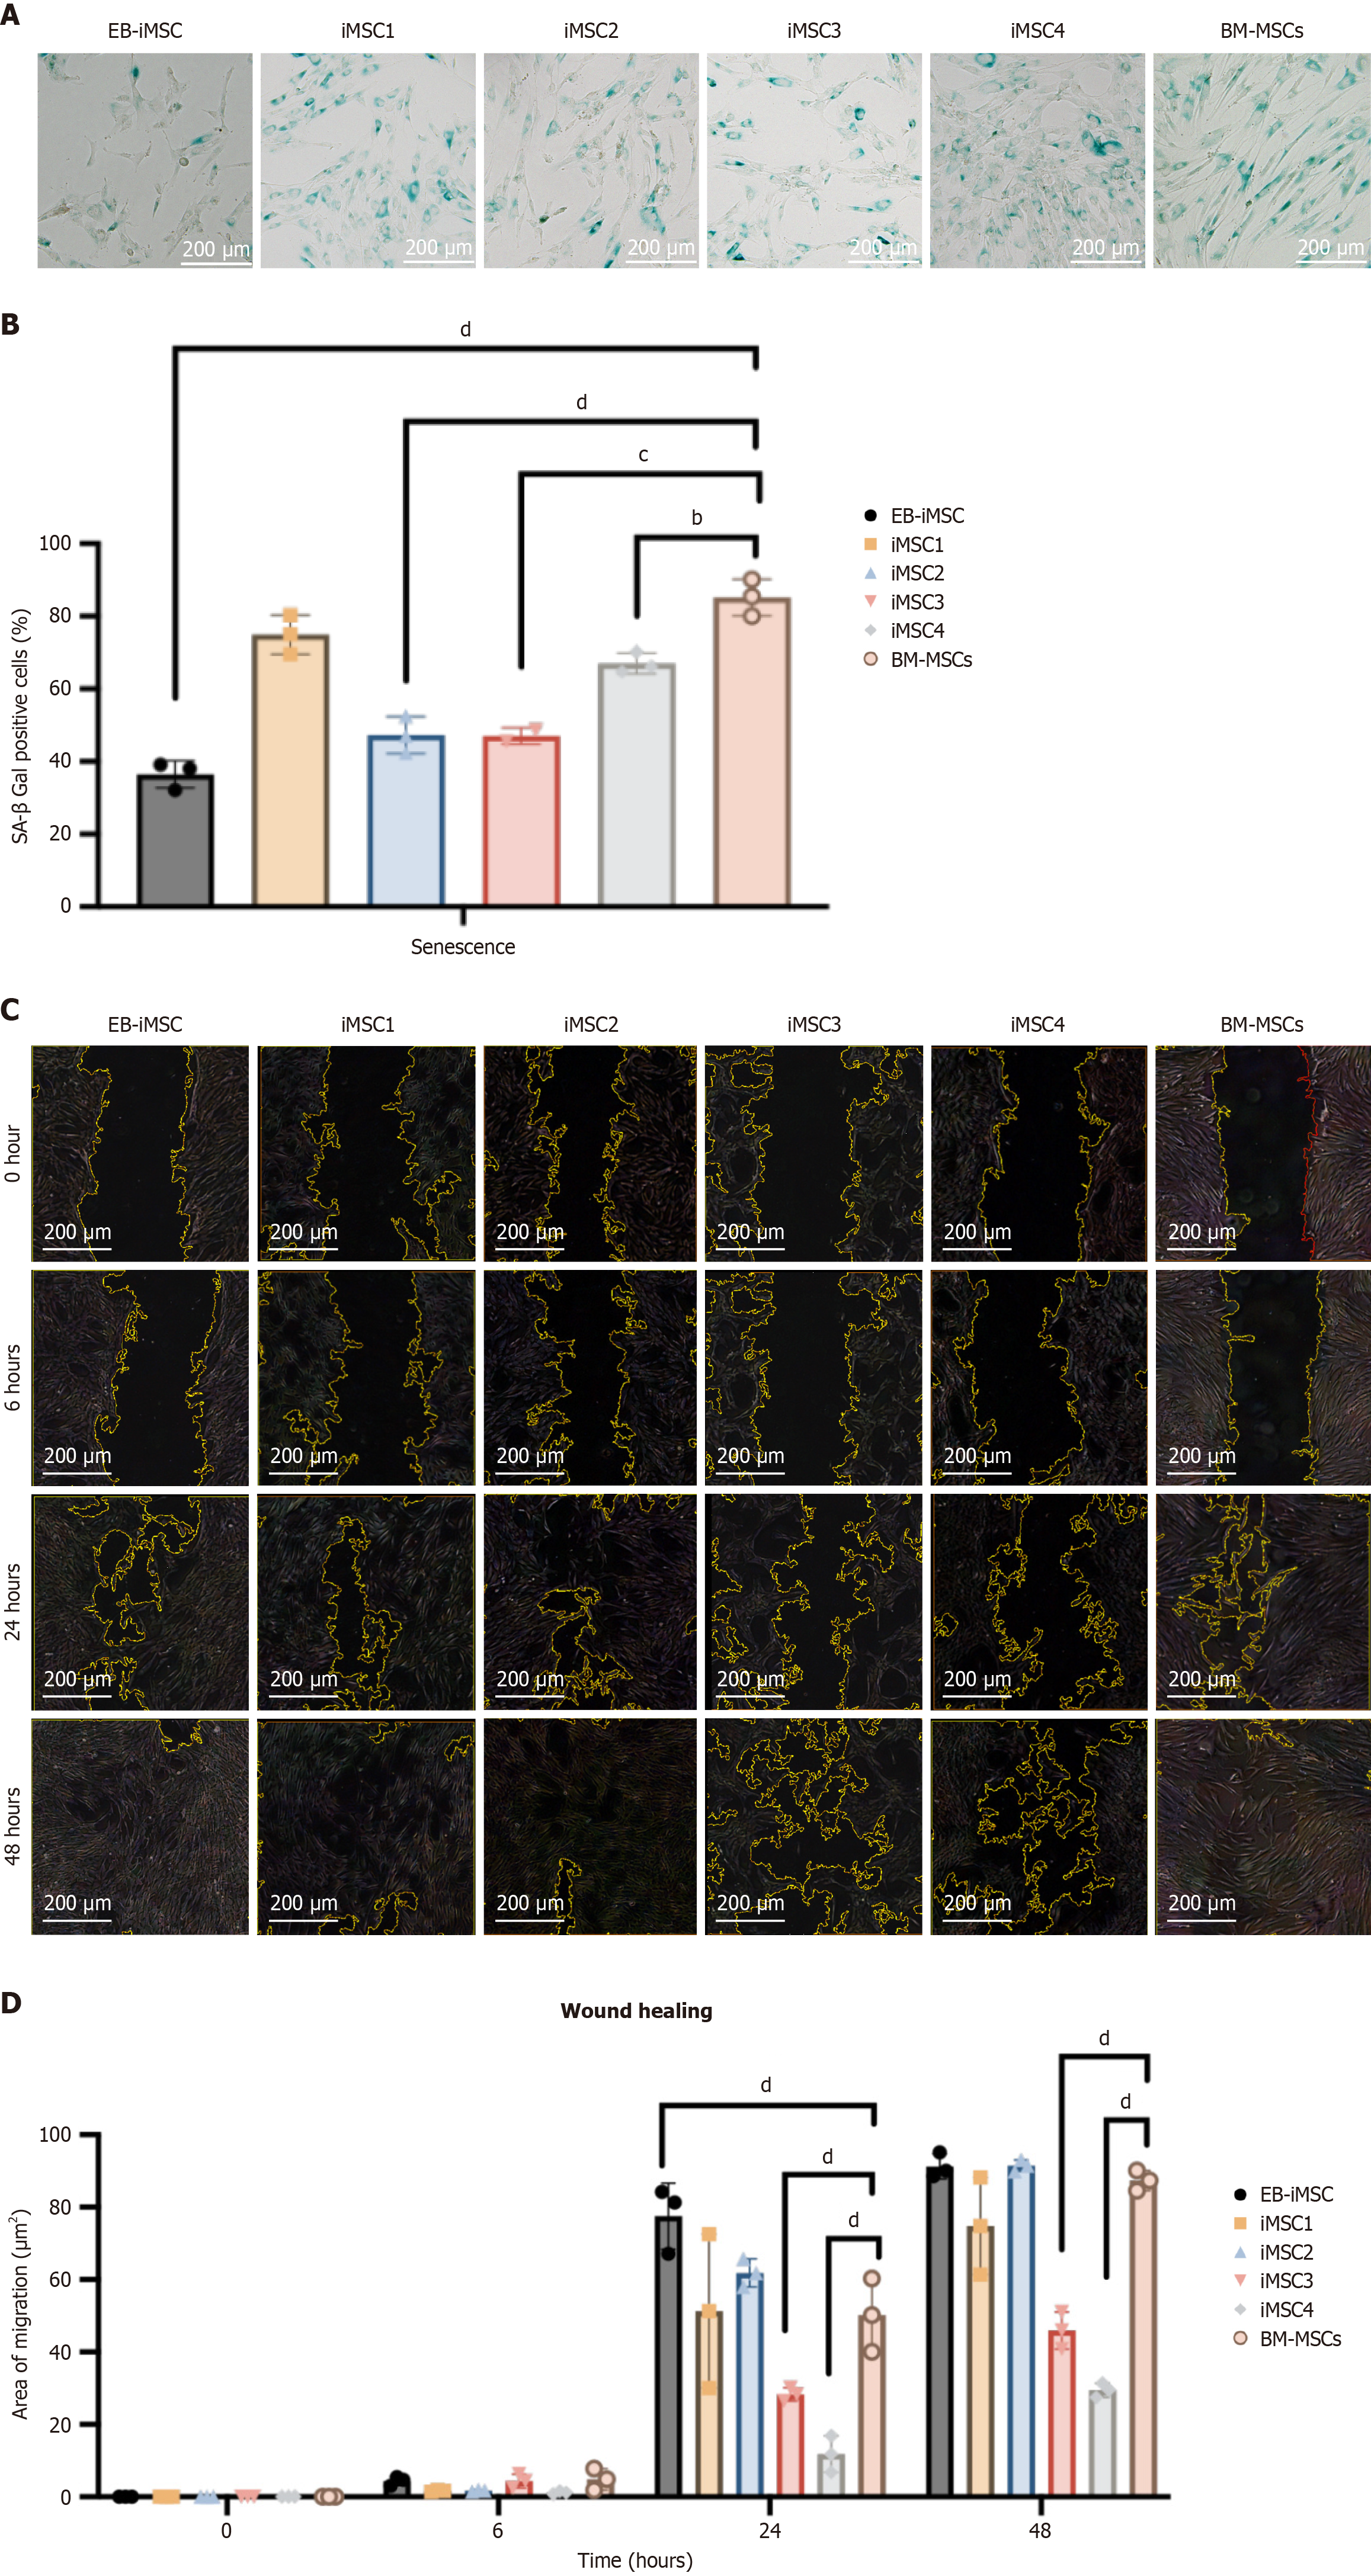
Figure 5 Assessment of senescence and migration in induced pluripotent stem cells-derived mesenchymal stem cell lines.
A: Repre
- Citation: Ababneh NA, Alwohoush E, AlDiqs R, Ismail MA, Al-Kurdi B, Barham R, Al-Atoom R, Nairat F, Al Hadidi S, Whaibi S, Gharandouq MH, Zalloum S, Al Shboul S, Al-Qaisi T, Abuhammad A, Saleh T, Awidi A. Impact of differentiation protocols on the functionality of mesenchymal stem cells derived from induced pluripotent stem cells. World J Stem Cells 2025; 17(12): 110564
- URL: https://www.wjgnet.com/1948-0210/full/v17/i12/110564.htm
- DOI: https://dx.doi.org/10.4252/wjsc.v17.i12.110564