
















©The Author(s) 2025.
World J Stem Cells. Oct 26, 2025; 17(10): 111978
Published online Oct 26, 2025. doi: 10.4252/wjsc.v17.i10.111978
Published online Oct 26, 2025. doi: 10.4252/wjsc.v17.i10.111978
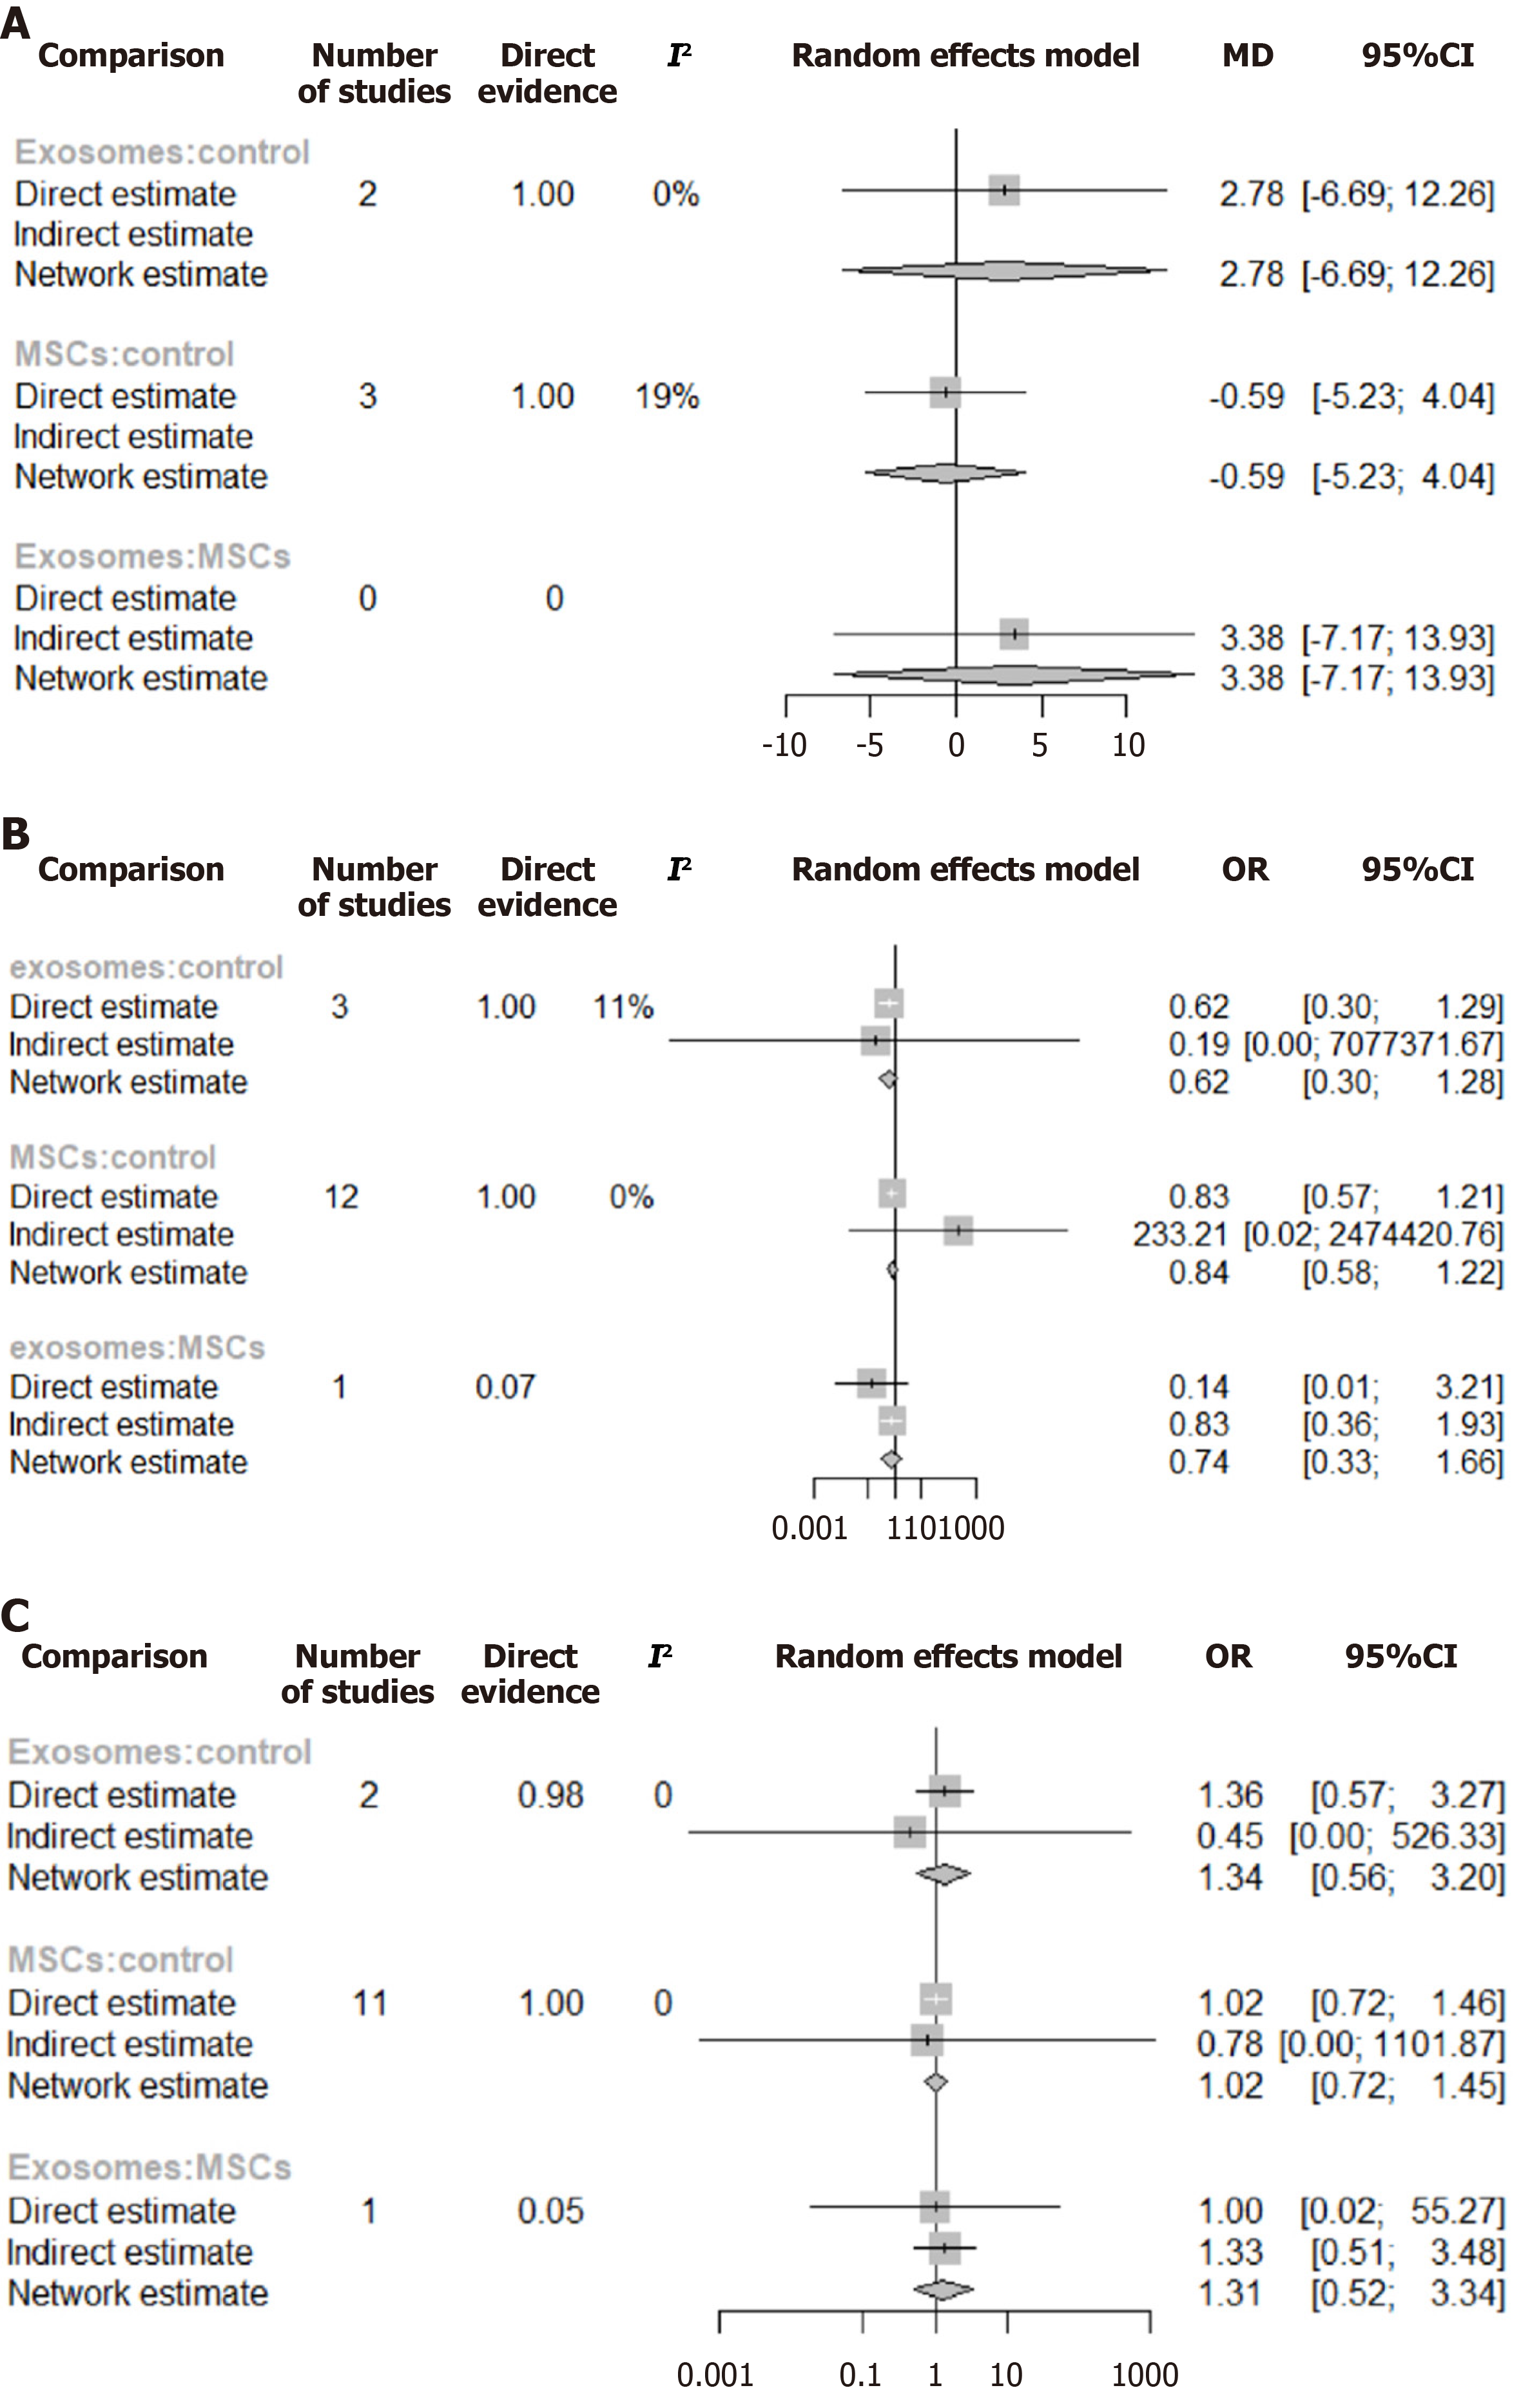
Figure 7 Network meta-analysis comparing exosomes and mesenchymal stem cells vs control interventions.
A-C: Forest plots showing mechanical ventilation-free days (mean difference) (A), mortality (odds ratio) (B), and adverse events (odds ratio) (C). Each panel displays direct estimates, indirect estimates, and network estimates, along with 95% confidence intervals. The analysis includes three treatment comparisons: Exosomes vs control, mesenchymal stem cells vs control, and exosomes vs mesenchymal stem cells. Numbers indicate the number of studies contributing to each comparison, with I2 values representing the level of heterogeneity. MD: Mean difference; OR: Odds ratio; CI: Confidence interval.
- Citation: Safwan M, Bourgleh MS, Al-Ruqi A, Shrebaty O, Almujaydil F, AlOthaim B, AlRashidi N, Haider KH. Living bio-drug therapies using mesenchymal stem cells and exosomes for mechanically ventilated patients with acute respiratory distress syndrome: A systematic review and meta-analysis. World J Stem Cells 2025; 17(10): 111978
- URL: https://www.wjgnet.com/1948-0210/full/v17/i10/111978.htm
- DOI: https://dx.doi.org/10.4252/wjsc.v17.i10.111978