















©The Author(s) 2025.
World J Stem Cells. Oct 26, 2025; 17(10): 111978
Published online Oct 26, 2025. doi: 10.4252/wjsc.v17.i10.111978
Published online Oct 26, 2025. doi: 10.4252/wjsc.v17.i10.111978
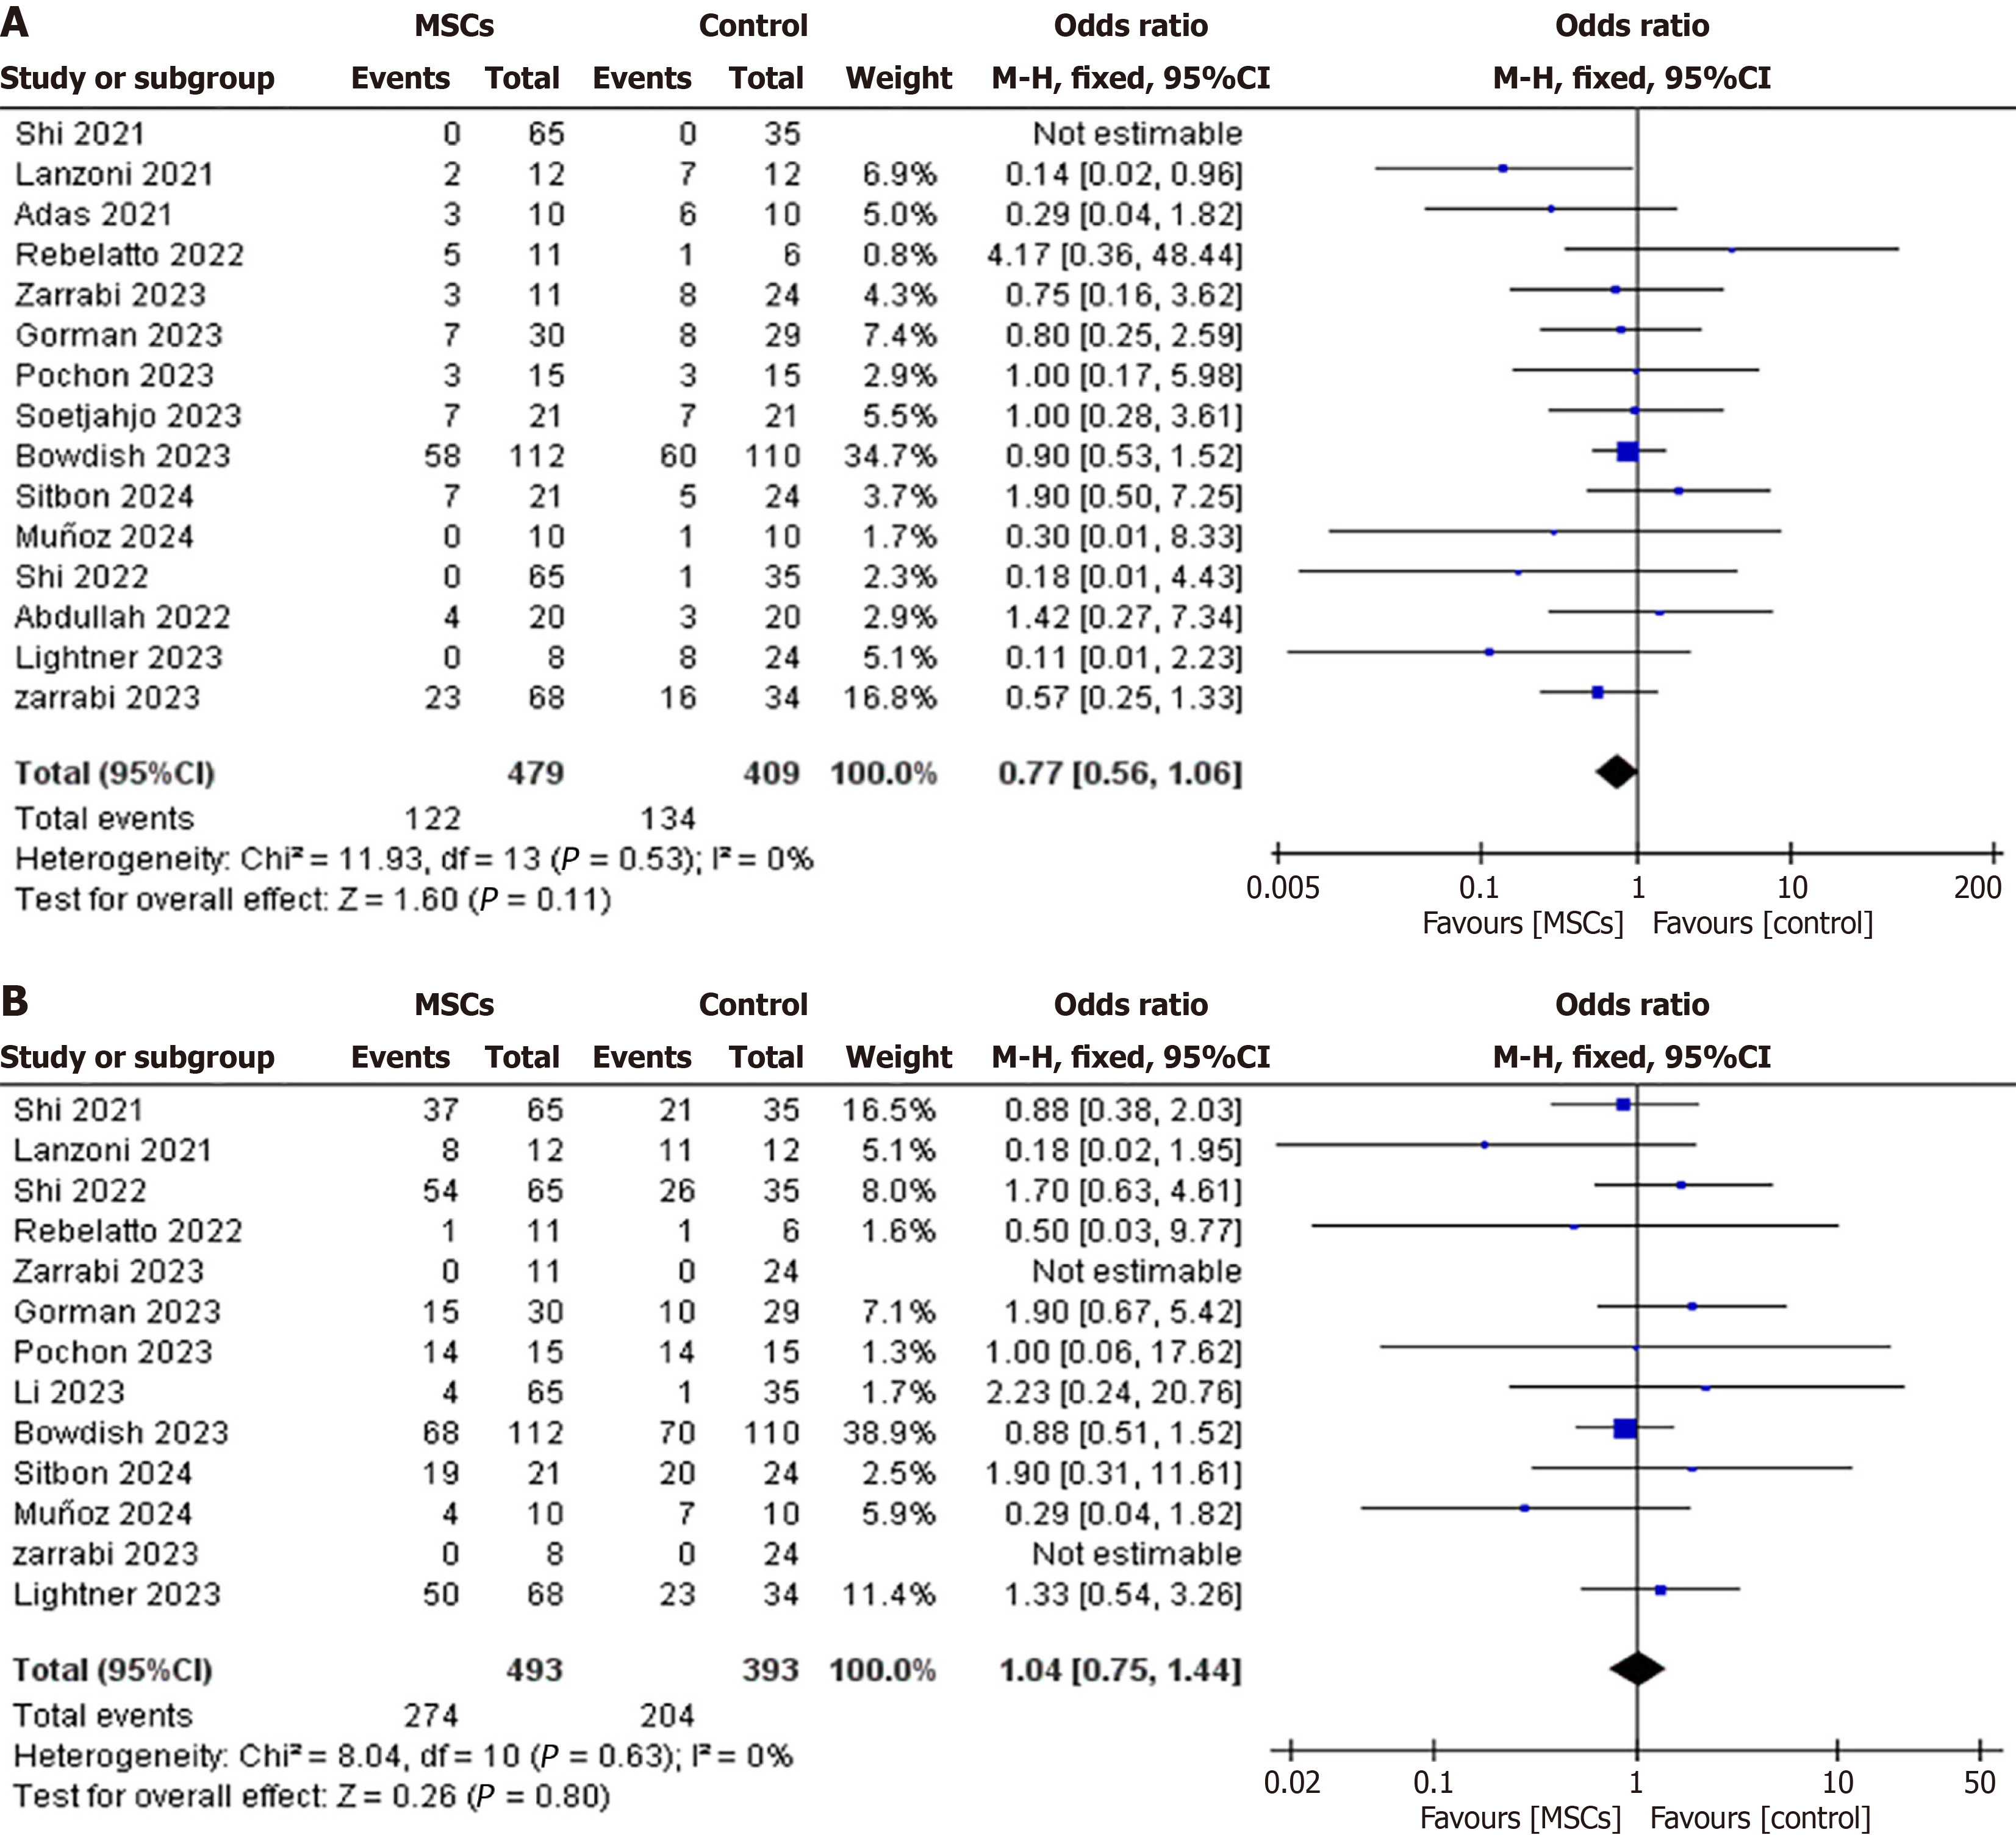
Figure 5 Forest plot showing the effect of mesenchymal stem cells and exosomes on mortality and odds ratio of adverse events.
A: Forest plot showing the effect of mesenchymal stem cells and exosomes on mortality rates; B: Forest plot showing the effect of mesenchymal stem cells and exosomes on the odds ratio of adverse events. The pooled odds ratio, along with its 95% confidence interval, is presented. Each square represents the effect estimate of an individual study, with the size proportional to its weight in the meta-analysis; horizontal lines denote the 95% confidence interval. The diamond indicates the overall pooled effect. MSC: Mesenchymal stem cell; CI: Confidence interval.
- Citation: Safwan M, Bourgleh MS, Al-Ruqi A, Shrebaty O, Almujaydil F, AlOthaim B, AlRashidi N, Haider KH. Living bio-drug therapies using mesenchymal stem cells and exosomes for mechanically ventilated patients with acute respiratory distress syndrome: A systematic review and meta-analysis. World J Stem Cells 2025; 17(10): 111978
- URL: https://www.wjgnet.com/1948-0210/full/v17/i10/111978.htm
- DOI: https://dx.doi.org/10.4252/wjsc.v17.i10.111978