
















©The Author(s) 2025.
World J Stem Cells. Oct 26, 2025; 17(10): 110445
Published online Oct 26, 2025. doi: 10.4252/wjsc.v17.i10.110445
Published online Oct 26, 2025. doi: 10.4252/wjsc.v17.i10.110445
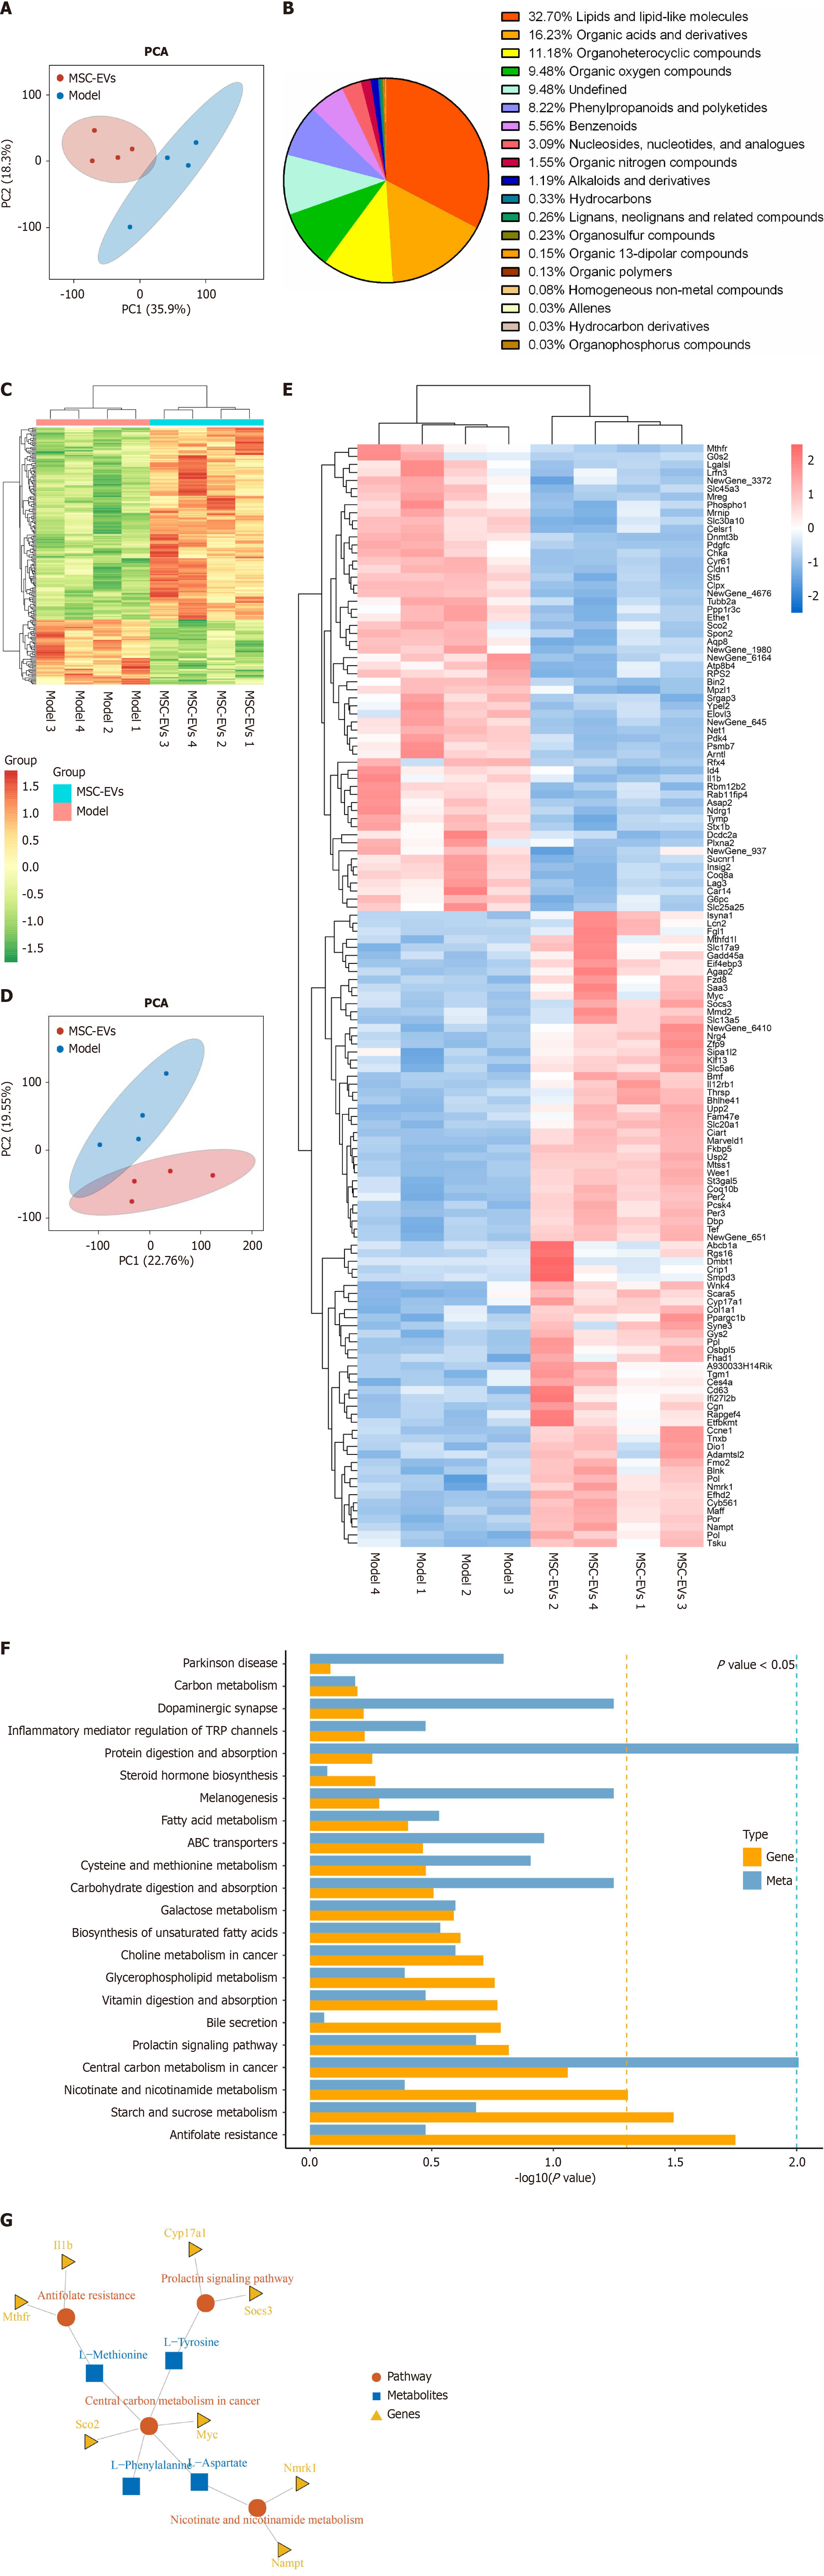
Figure 5 Integrated transcriptomic and metabolomic analysis.
A: A score plot of the principal component analysis representing metabolomic differences between the model group (in blue) and the mice were treated with extracellular vesicles derived from mesenchymal stromal cells (MSC-EVs) after induction with D-galactose group (in red). The cross-validation of the predicted model showed a PC1 value of 35.89% for the first component and a PC2 value of 18.34% for the second component for all patterns (positive and negative total ions); B: Metabolite categorization. Classification of the 4416 identified metabolites, providing an overview of the metabolic diversity affected by treatment with MSC-EVs; C: A clustered heatmap of differentially abundant metabolites was constructed to illustrate the patterns of metabolite expression across samples, showing how these patterns are altered after treatment with MSC-EVs; D: A score plot of principal component analysis representing transcriptomic differences between the model group (in blue) and the MSC-EV-treated group (in red); E: Hierarchical clustering analysis of all differentially expressed genes. The heatmap with dendrograms represents the patterns of gene expression and clustering of genes with similar expression profiles; F: A bar chart of the top 30 Kyoto Encyclopedia of Genes and Genomes (KEGG) pathways significantly enriched for differentially expressed genes and metabolites, ranked according to the level of enrichment; G: A KEGG pathway analysis (kgml) map. A visual representation of the pathways, where different shapes and colors denote distinct types. Red circles represent KEGG pathways, blue squares represent metabolites, and yellow triangles represent genes. MSC-EVs: Extracellular vesicles derived from mesenchymal stromal cells; PCA: Principal component analysis.
- Citation: Yang SS, Chen SY, Zhuang WY, Han J, Liu Y, Deng L, Guo HZ, Ma HR, Tan Y. Efficacy of extracellular vesicles derived from mesenchymal stromal cells in regulating senescence: In vitro and in vivo insights. World J Stem Cells 2025; 17(10): 110445
- URL: https://www.wjgnet.com/1948-0210/full/v17/i10/110445.htm
- DOI: https://dx.doi.org/10.4252/wjsc.v17.i10.110445