
















©The Author(s) 2025.
World J Stem Cells. Oct 26, 2025; 17(10): 109862
Published online Oct 26, 2025. doi: 10.4252/wjsc.v17.i10.109862
Published online Oct 26, 2025. doi: 10.4252/wjsc.v17.i10.109862
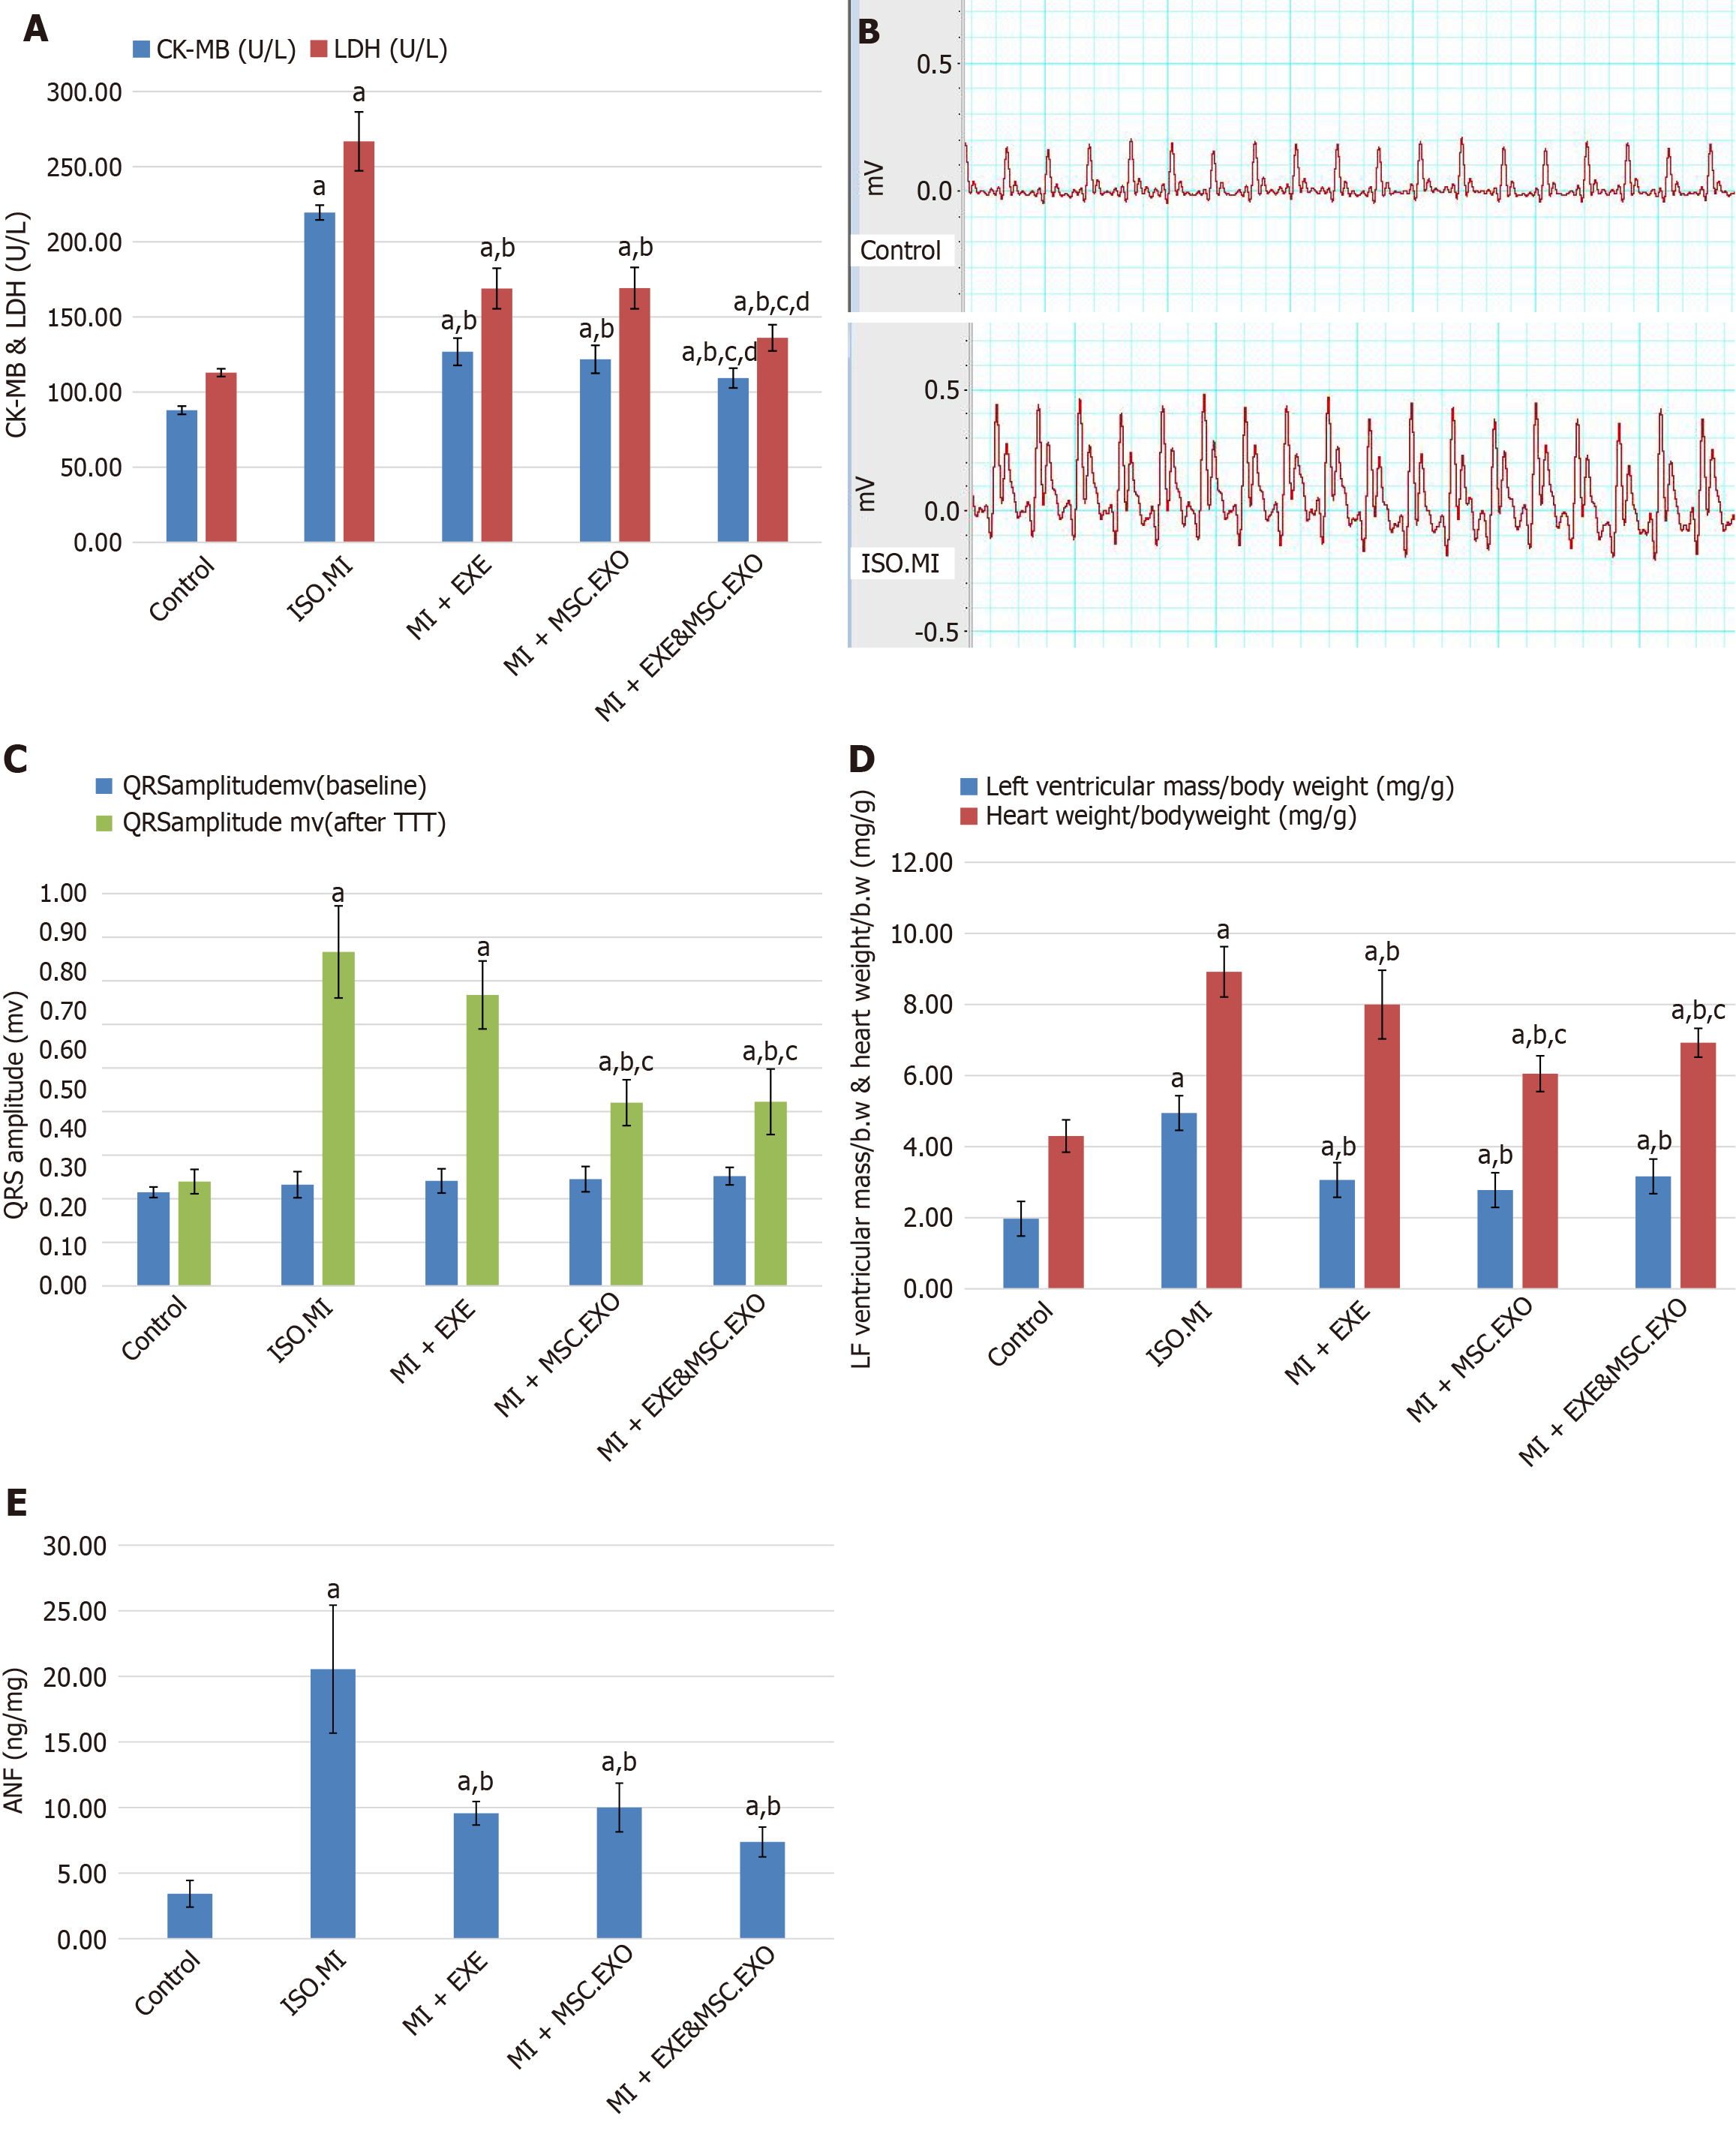
Figure 3 Quantitative analysis of ischemic cardiac hypertrophy in different groups.
A: Cardiac enzyme level in different groups; B: Electrocardiogram in the control and the induction of myocardial infarction was performed using isoproterenol groups; C: QRS amplitude in different groups; D: Heart weight index level in different groups; E: Atrial natriuretic factor level in different groups. Values represent means ± SD (n = 8). aP < 0.05, compared to the control group; bP < 0.05, compared to the induction of myocardial infarction was performed using isoproterenol group; cP < 0.05, compared to MI + EXE group; dP < 0.05, compared to MI + MSC-EXO group. MSC-EXO: Mesenchymal stem cell-derived exosomes.
- Citation: ShamsEldeen AM, AbdElalim MM, Mohamed NS, AbdelRahman MM, Kamar SS, AbdelKader DH, Elsharkawy SH, Rashed LA, Faisal SS, Osman WA, Selmy AM. Mesenchymal stem-derived exosomes enhance therapeutic benefits of exercise in isoproterenol-induced myocardial ischemia: Targeting ERK and Akt/mTOR signaling. World J Stem Cells 2025; 17(10): 109862
- URL: https://www.wjgnet.com/1948-0210/full/v17/i10/109862.htm
- DOI: https://dx.doi.org/10.4252/wjsc.v17.i10.109862