
















©The Author(s) 2025.
World J Stem Cells. Oct 26, 2025; 17(10): 109369
Published online Oct 26, 2025. doi: 10.4252/wjsc.v17.i10.109369
Published online Oct 26, 2025. doi: 10.4252/wjsc.v17.i10.109369
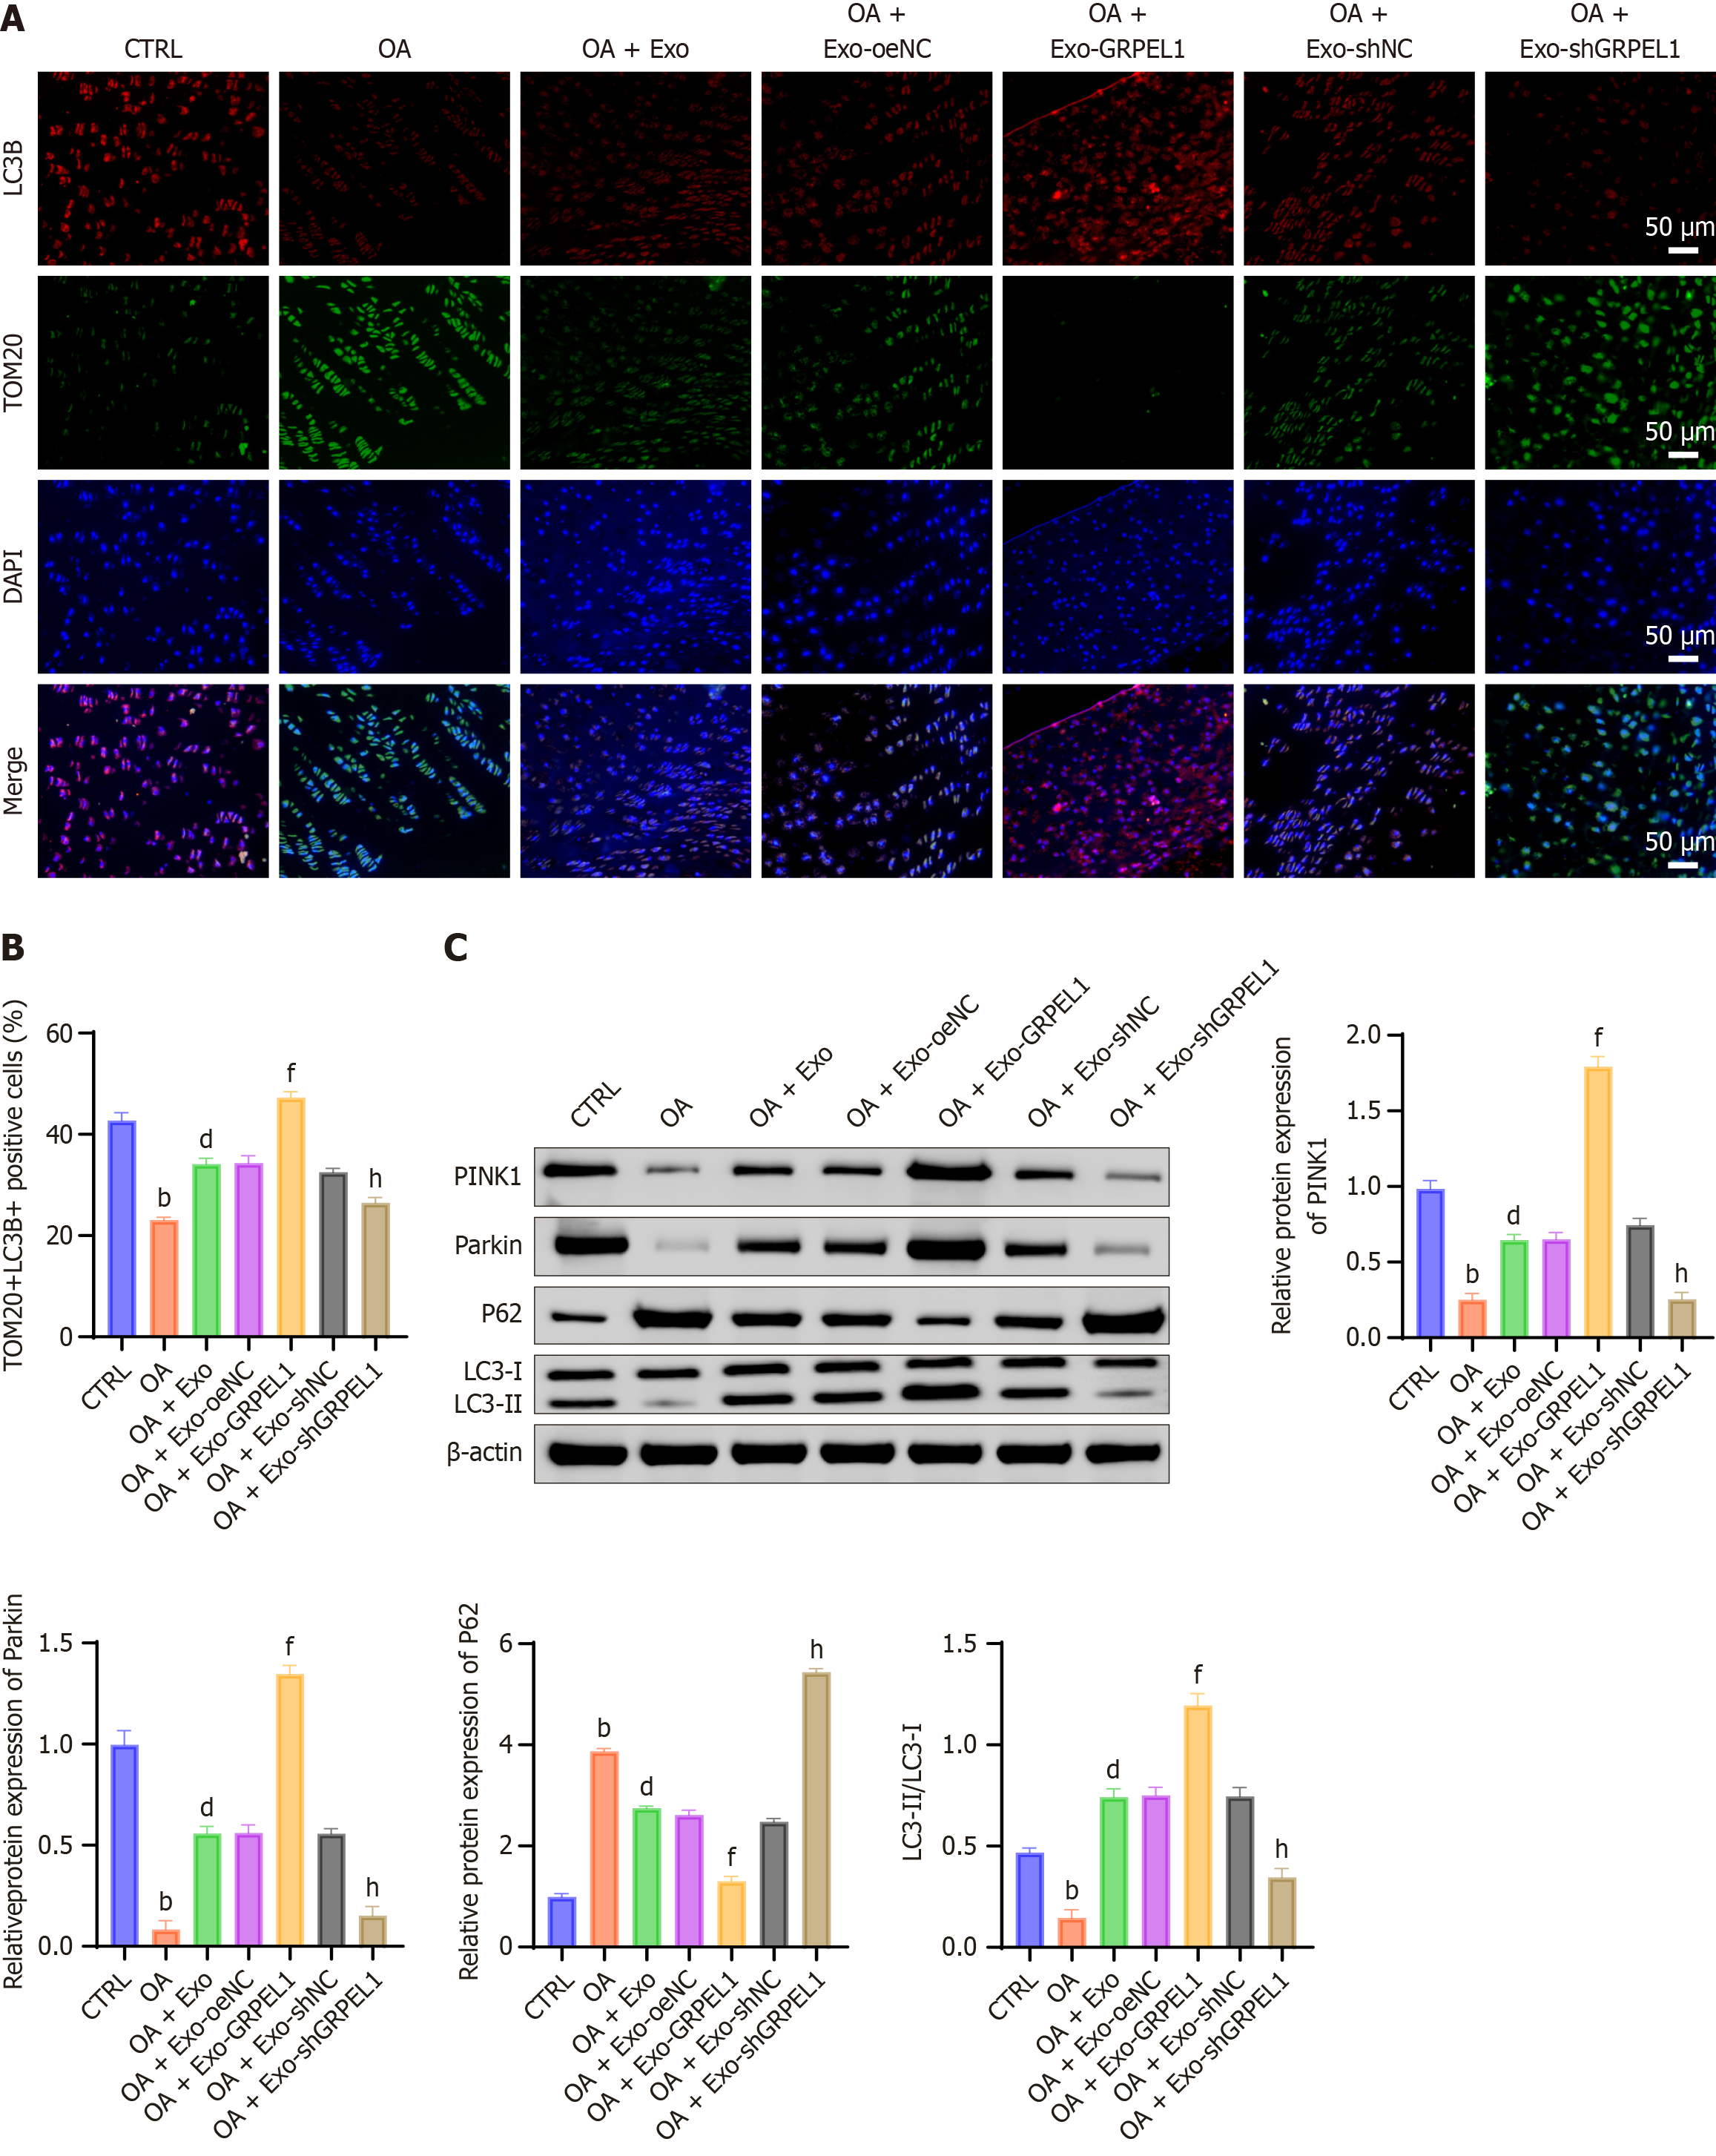
Figure 9 Mitochondrial autophagy assessment in rat osteoarthritis cartilage cells after stem cell-derived exosomes GrpE-like 1 delivery.
A: Immunofluorescence analysis of translocase of the outer membrane 20 and light chain 3B in rat cartilage tissue, visualizing mitochondrial and autophagic marker co-localization; B: Quantitative analysis of TOM20+LC3B+ double-positive cells based on immunofluorescence staining shown in (A), indicating the extent of mitophagy activation across experimental groups; C: Western blot analysis of mitophagy-related proteins (phosphatase and tensin homolog-induced putative kinase 1, parkin, P62, light chain 3 II/I) using protein lysates extracted from rat cartilage tissue, demonstrating mitochondrial quality control mechanisms. Scale bar: 50 μm. bP < 0.01 vs control; dP < 0.01 vs IL-1β; fP < 0.01 vs IL-1β + Exo-oeNC; hP < 0.01 vs IL-1β + Exo-shNC. TOM20: Translocase of the outer membrane 20; LC3B: Light chain 3B; DAPI: 4’-6-diamidino-2-phenylindole; PINK1: Phosphatase and tensin homolog-induced putative kinase 1; LC3-II/LC3-I: Light chain 3 II/I.
- Citation: Xiang CH, Zou L, Huang ZG, Zhang GJ, Zeng HL, He ZX, Dai ZS. Synovial mesenchymal stem cell-derived exosomes delivering GRPEL1 activate PINK1-mediated mitophagy to promote cartilage repair in arthritis. World J Stem Cells 2025; 17(10): 109369
- URL: https://www.wjgnet.com/1948-0210/full/v17/i10/109369.htm
- DOI: https://dx.doi.org/10.4252/wjsc.v17.i10.109369