
















©The Author(s) 2025.
World J Stem Cells. Oct 26, 2025; 17(10): 109369
Published online Oct 26, 2025. doi: 10.4252/wjsc.v17.i10.109369
Published online Oct 26, 2025. doi: 10.4252/wjsc.v17.i10.109369
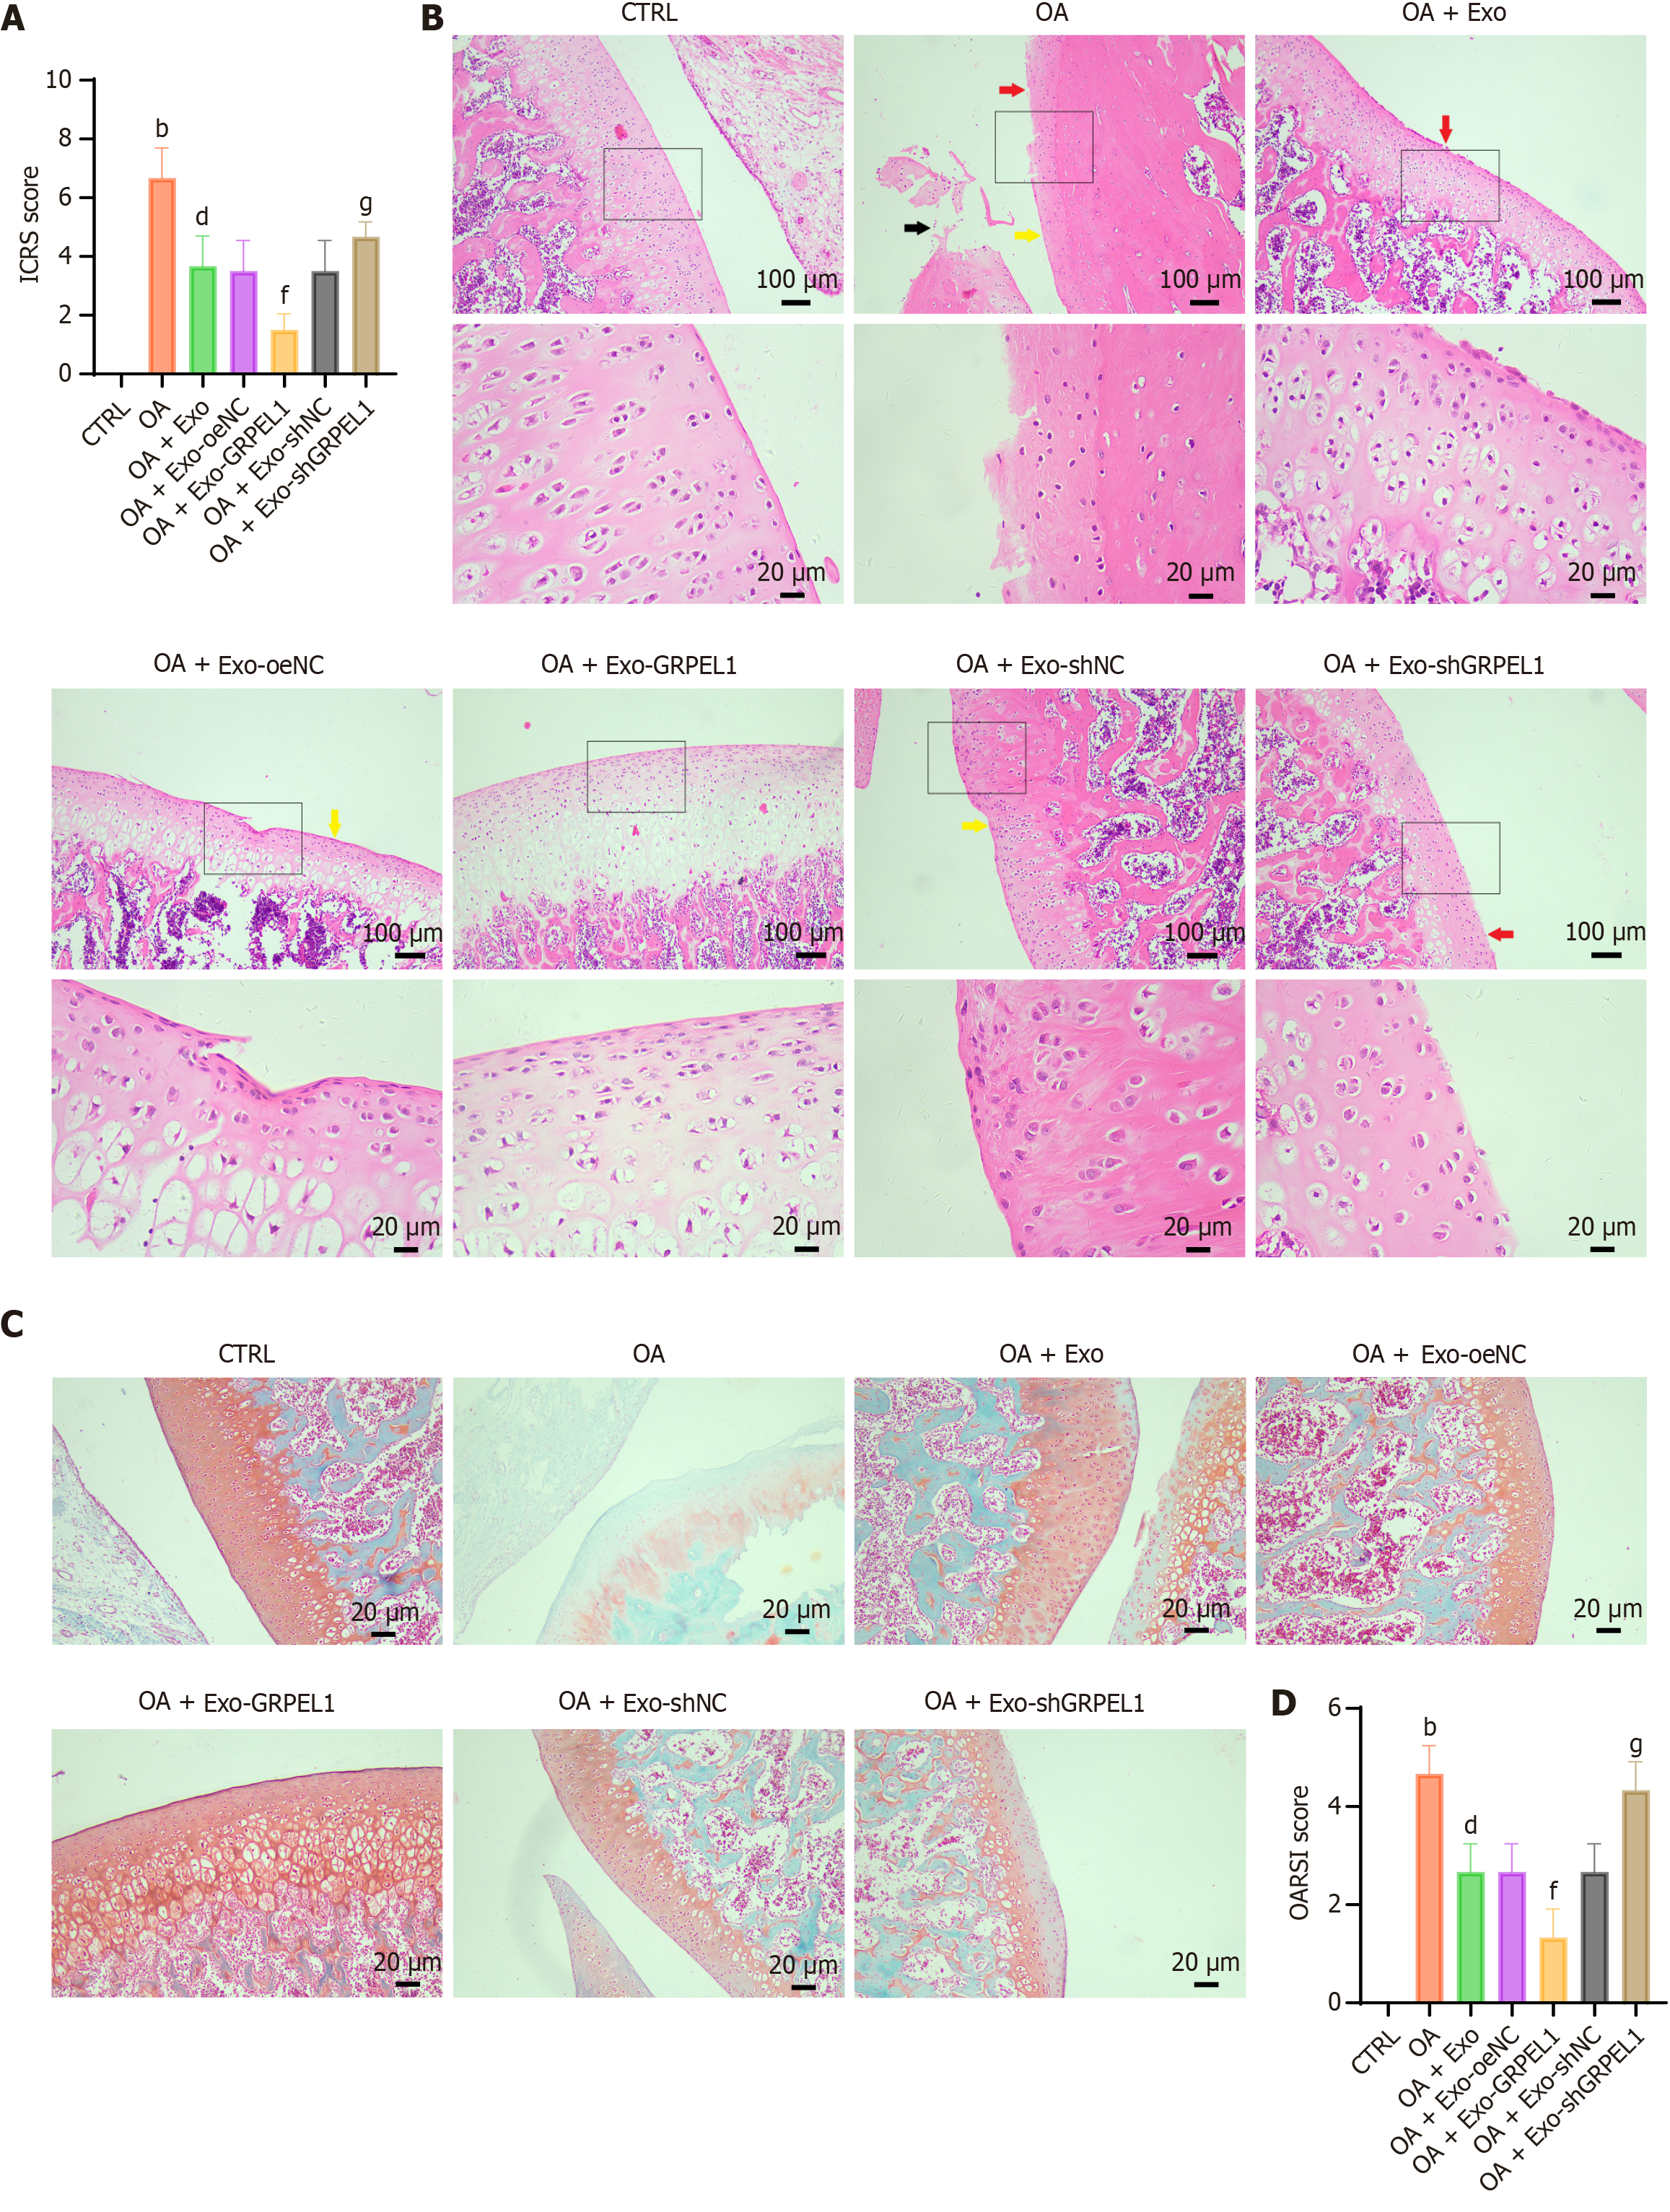
Figure 7 Cartilage injury assessment in rat osteoarthritis model after synovial mesenchymal stem cell-derived exosomes GrpE-like 1 delivery.
The figure evaluates cartilage repair and osteoarthritis progression across experimental groups. A: International Cartilage Repair Society macroscopic scoring of rat knee joints, providing comprehensive visual assessment of cartilage damage; B: Hematoxylin and eosin staining of knee cartilage tissue, revealing histological structural changes and inflammatory responses, red arrows indicate areas of cartilage surface erosion; yellow arrows indicate chondrocyte clustering; black arrows indicate matrix degradation or fissures; C: Safranin-O-Fast Green staining, demonstrating proteoglycan content and matrix integrity in cartilage tissue; D: Osteoarthritis Research Society International scoring, quantitatively assessing cartilage degeneration severity. Scale bar: 100 μm and 20 μm. bP < 0.01 vs control; dP < 0.01 vs OA; fP < 0.01 vs OA + Exo-oeNC; gP < 0.05 vs OA + Exo-shNC. ICRS: International Cartilage Repair Society; OA: Osteoarthritis; Exo: Exosome; OARSI: Osteoarthritis research society international.
- Citation: Xiang CH, Zou L, Huang ZG, Zhang GJ, Zeng HL, He ZX, Dai ZS. Synovial mesenchymal stem cell-derived exosomes delivering GRPEL1 activate PINK1-mediated mitophagy to promote cartilage repair in arthritis. World J Stem Cells 2025; 17(10): 109369
- URL: https://www.wjgnet.com/1948-0210/full/v17/i10/109369.htm
- DOI: https://dx.doi.org/10.4252/wjsc.v17.i10.109369