
















©The Author(s) 2025.
World J Stem Cells. Oct 26, 2025; 17(10): 109369
Published online Oct 26, 2025. doi: 10.4252/wjsc.v17.i10.109369
Published online Oct 26, 2025. doi: 10.4252/wjsc.v17.i10.109369
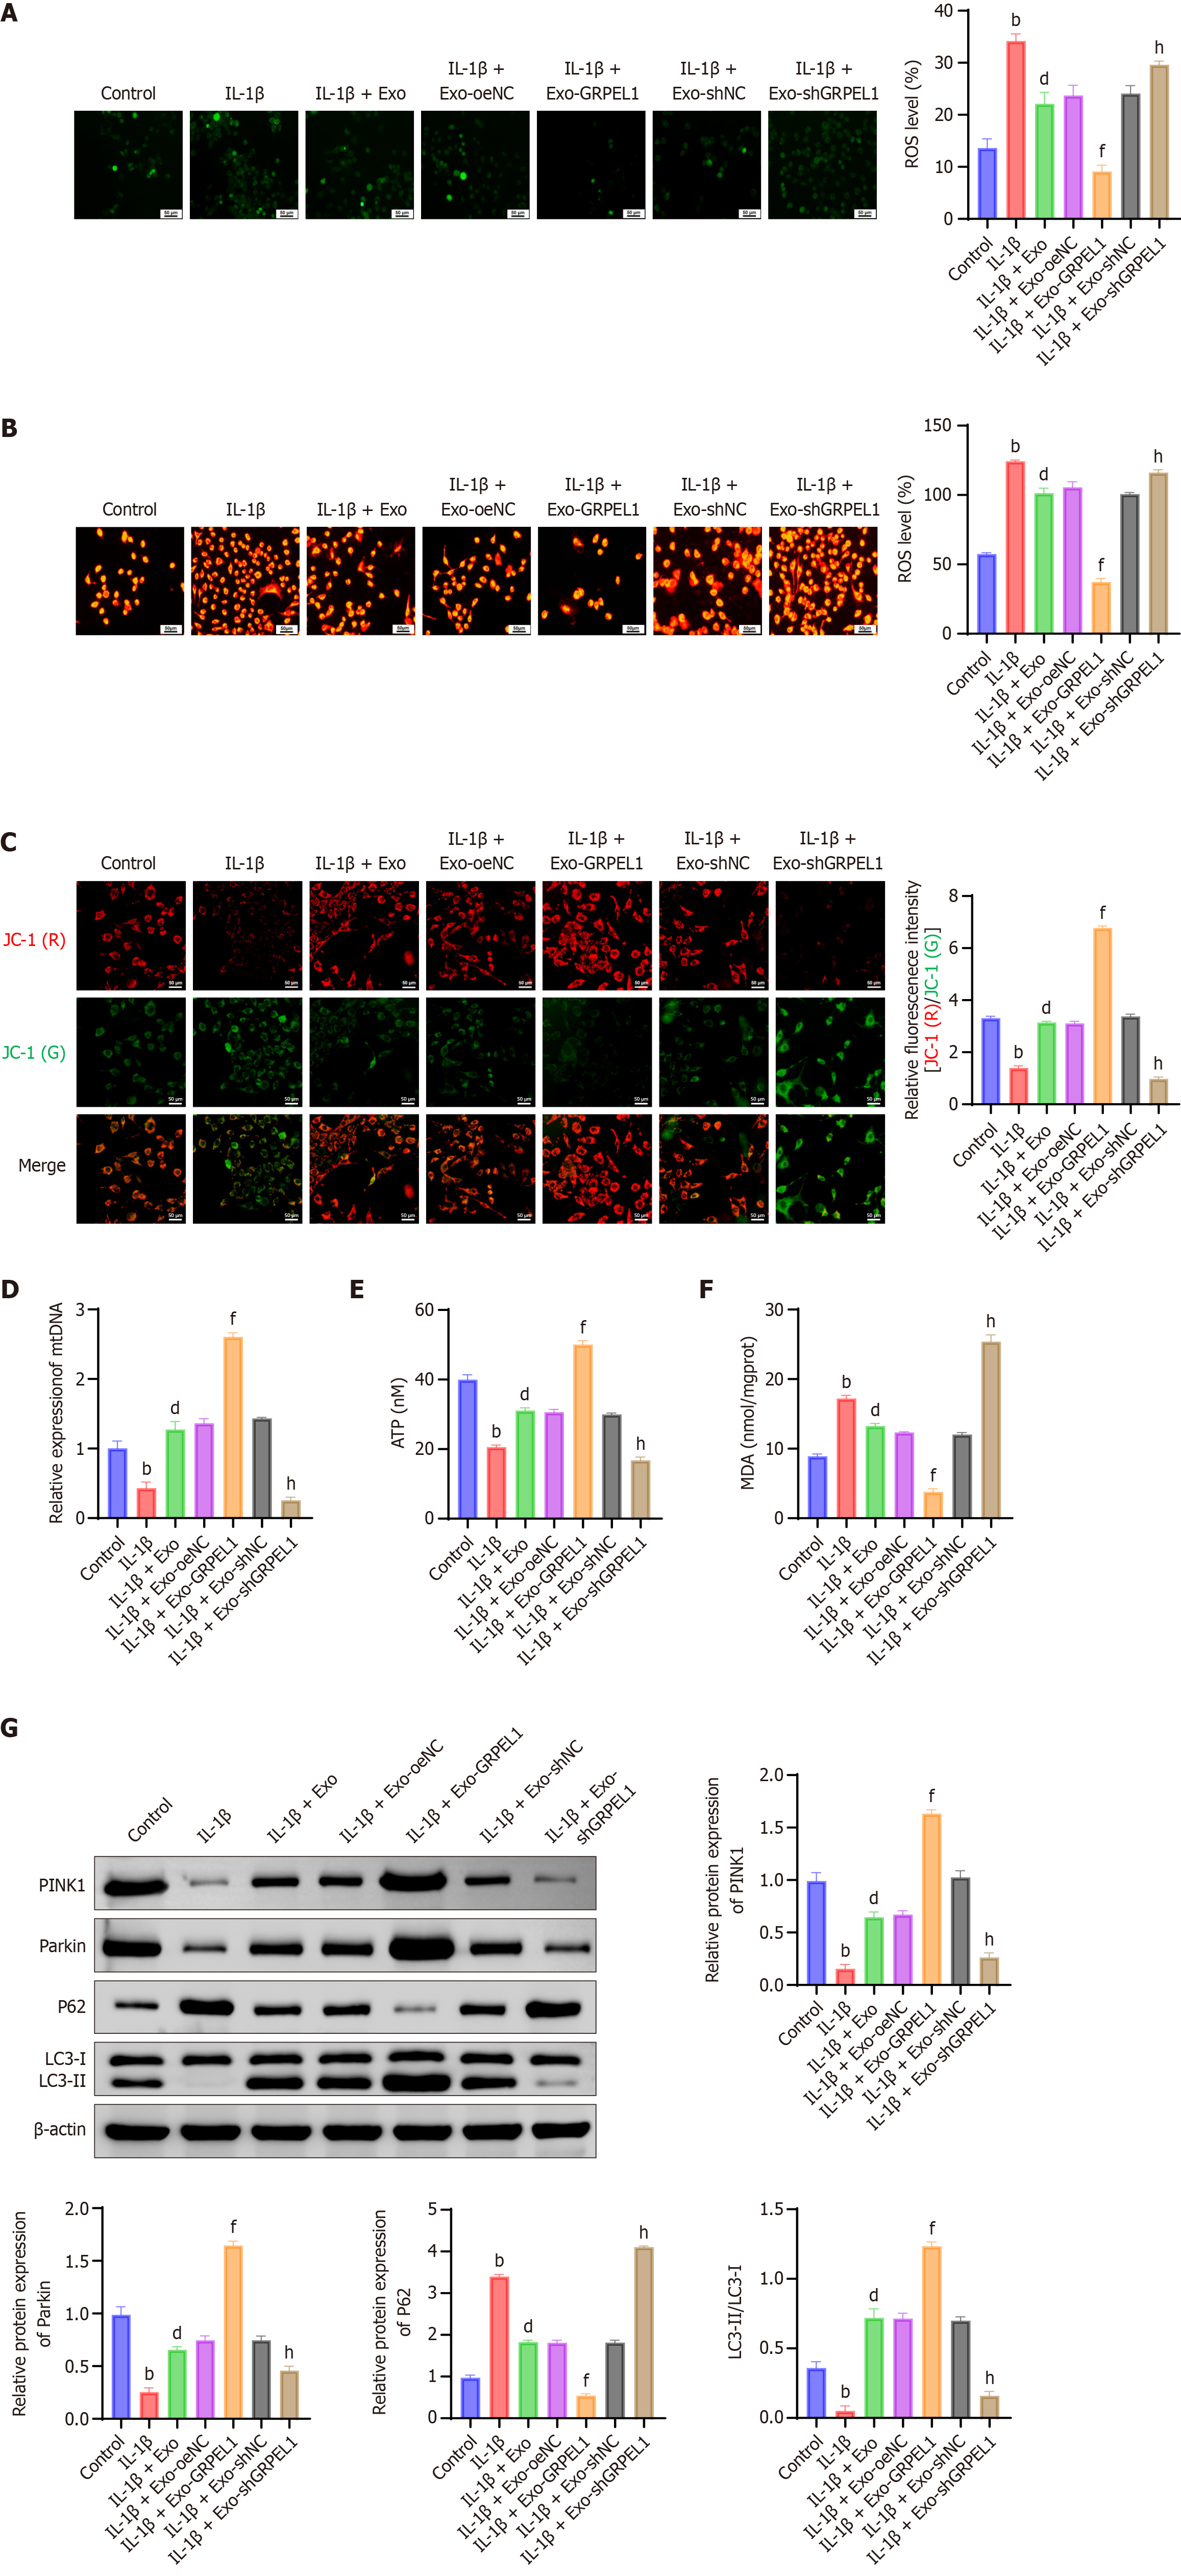
Figure 6 Synovial mesenchymal stem cell-derived exosomes delivery of GrpE-like 1 mitigates mitochondrial dysfunction in interleukin-1 beta-induced CHON-001 cells.
A: Total reactive oxygen species (ROS) levels measured by commercial assay kit, indicating cellular oxidative stress. Intracellular ROS levels indicated by green fluorescence, reflecting oxidative stress levels; B: Mitochondrial ROS quantification, revealing specific mitochondrial oxidative damage; C: Mitochondrial membrane potential (JC-1 assay) assessment, evaluating mitochondrial membrane integrity and functional status. JC-1 exists as a monomer emitting green fluorescence [JC-1 (green)] when the mitochondrial membrane potential (ψm) is low, and forms aggregates emitting red fluorescence [JC-1 (red)] when ψm is high; D: Mitochondrial DNA quantification was performed using a commercial mitochondrial DNA isolation kit (Beyotime, Shanghai, China), followed by quantitative polymerase chain reaction using specific primers targeting mitochondrial genes. Mitochondrial DNA quantification, examining mitochondrial genetic material preservation; E: Cellular ATP levels were measured using the Enhanced ATP assay Kit (Beyotime, Shanghai, China), based on the luciferase-luciferin bioluminescence method, according to the manufacturer’s instructions. Cellular ATP level measurement, indicating mitochondrial energy production capacity; F: Malondialdehyde (MDA) levels were detected using a lipid peroxidation MDA assay kit (Beyotime, Shanghai, China), based on the thiobarbituric acid method, following the manufacturer’s protocol. MDA levels, reflecting lipid peroxidation and oxidative stress intensity; G: Western blot analysis of mitophagy-related proteins (phosphatase and tensin homolog-induced putative kinase 1, parkin, P62, light chain 3 II/I), demonstrating mitochondrial quality control mechanisms and autophagic flux. Flow cytometry gating strategy: After 2’,7’-dichlorodihydrofluorescein diacetate or MitoSOX staining, cells were first gated using forward scatter (FSC) vs side scatter to exclude debris. Subsequently, singlet cells were selected based on FSC-H vs FSC-A. Fluorescence intensity of 2’,7’-dichlorodihydrofluorescein diacetate or MitoSOX was then analyzed in the FITC (for total ROS) or PE (for mitochondrial ROS) channel, respectively, using BD FACSCelesta (Becton Dickinson, NJ, United States). A minimum of 10000 events per sample were collected. Scale bar: 50 μm. bP < 0.01 vs control; dP < 0.01 vs IL-1β; fP < 0.01 vs IL-1β + Exo-oeNC; hP < 0.01 vs IL-1β + Exo-shNC. IL-1β: Interleukin-1 beta; Exo: Exosome; GRPEL1: GrpE-like 1; mtDNA: Mitochondrial DNA; ROS: Reactive oxygen species; ATP: Adenosine triphosphate; MDA: Malondialdehyde; PINK1: Phosphatase and tensin homolog-induced putative kinase 1; LC3-II/LC3-I: Light chain 3 II/I.
- Citation: Xiang CH, Zou L, Huang ZG, Zhang GJ, Zeng HL, He ZX, Dai ZS. Synovial mesenchymal stem cell-derived exosomes delivering GRPEL1 activate PINK1-mediated mitophagy to promote cartilage repair in arthritis. World J Stem Cells 2025; 17(10): 109369
- URL: https://www.wjgnet.com/1948-0210/full/v17/i10/109369.htm
- DOI: https://dx.doi.org/10.4252/wjsc.v17.i10.109369