
















©The Author(s) 2025.
World J Stem Cells. Oct 26, 2025; 17(10): 109369
Published online Oct 26, 2025. doi: 10.4252/wjsc.v17.i10.109369
Published online Oct 26, 2025. doi: 10.4252/wjsc.v17.i10.109369
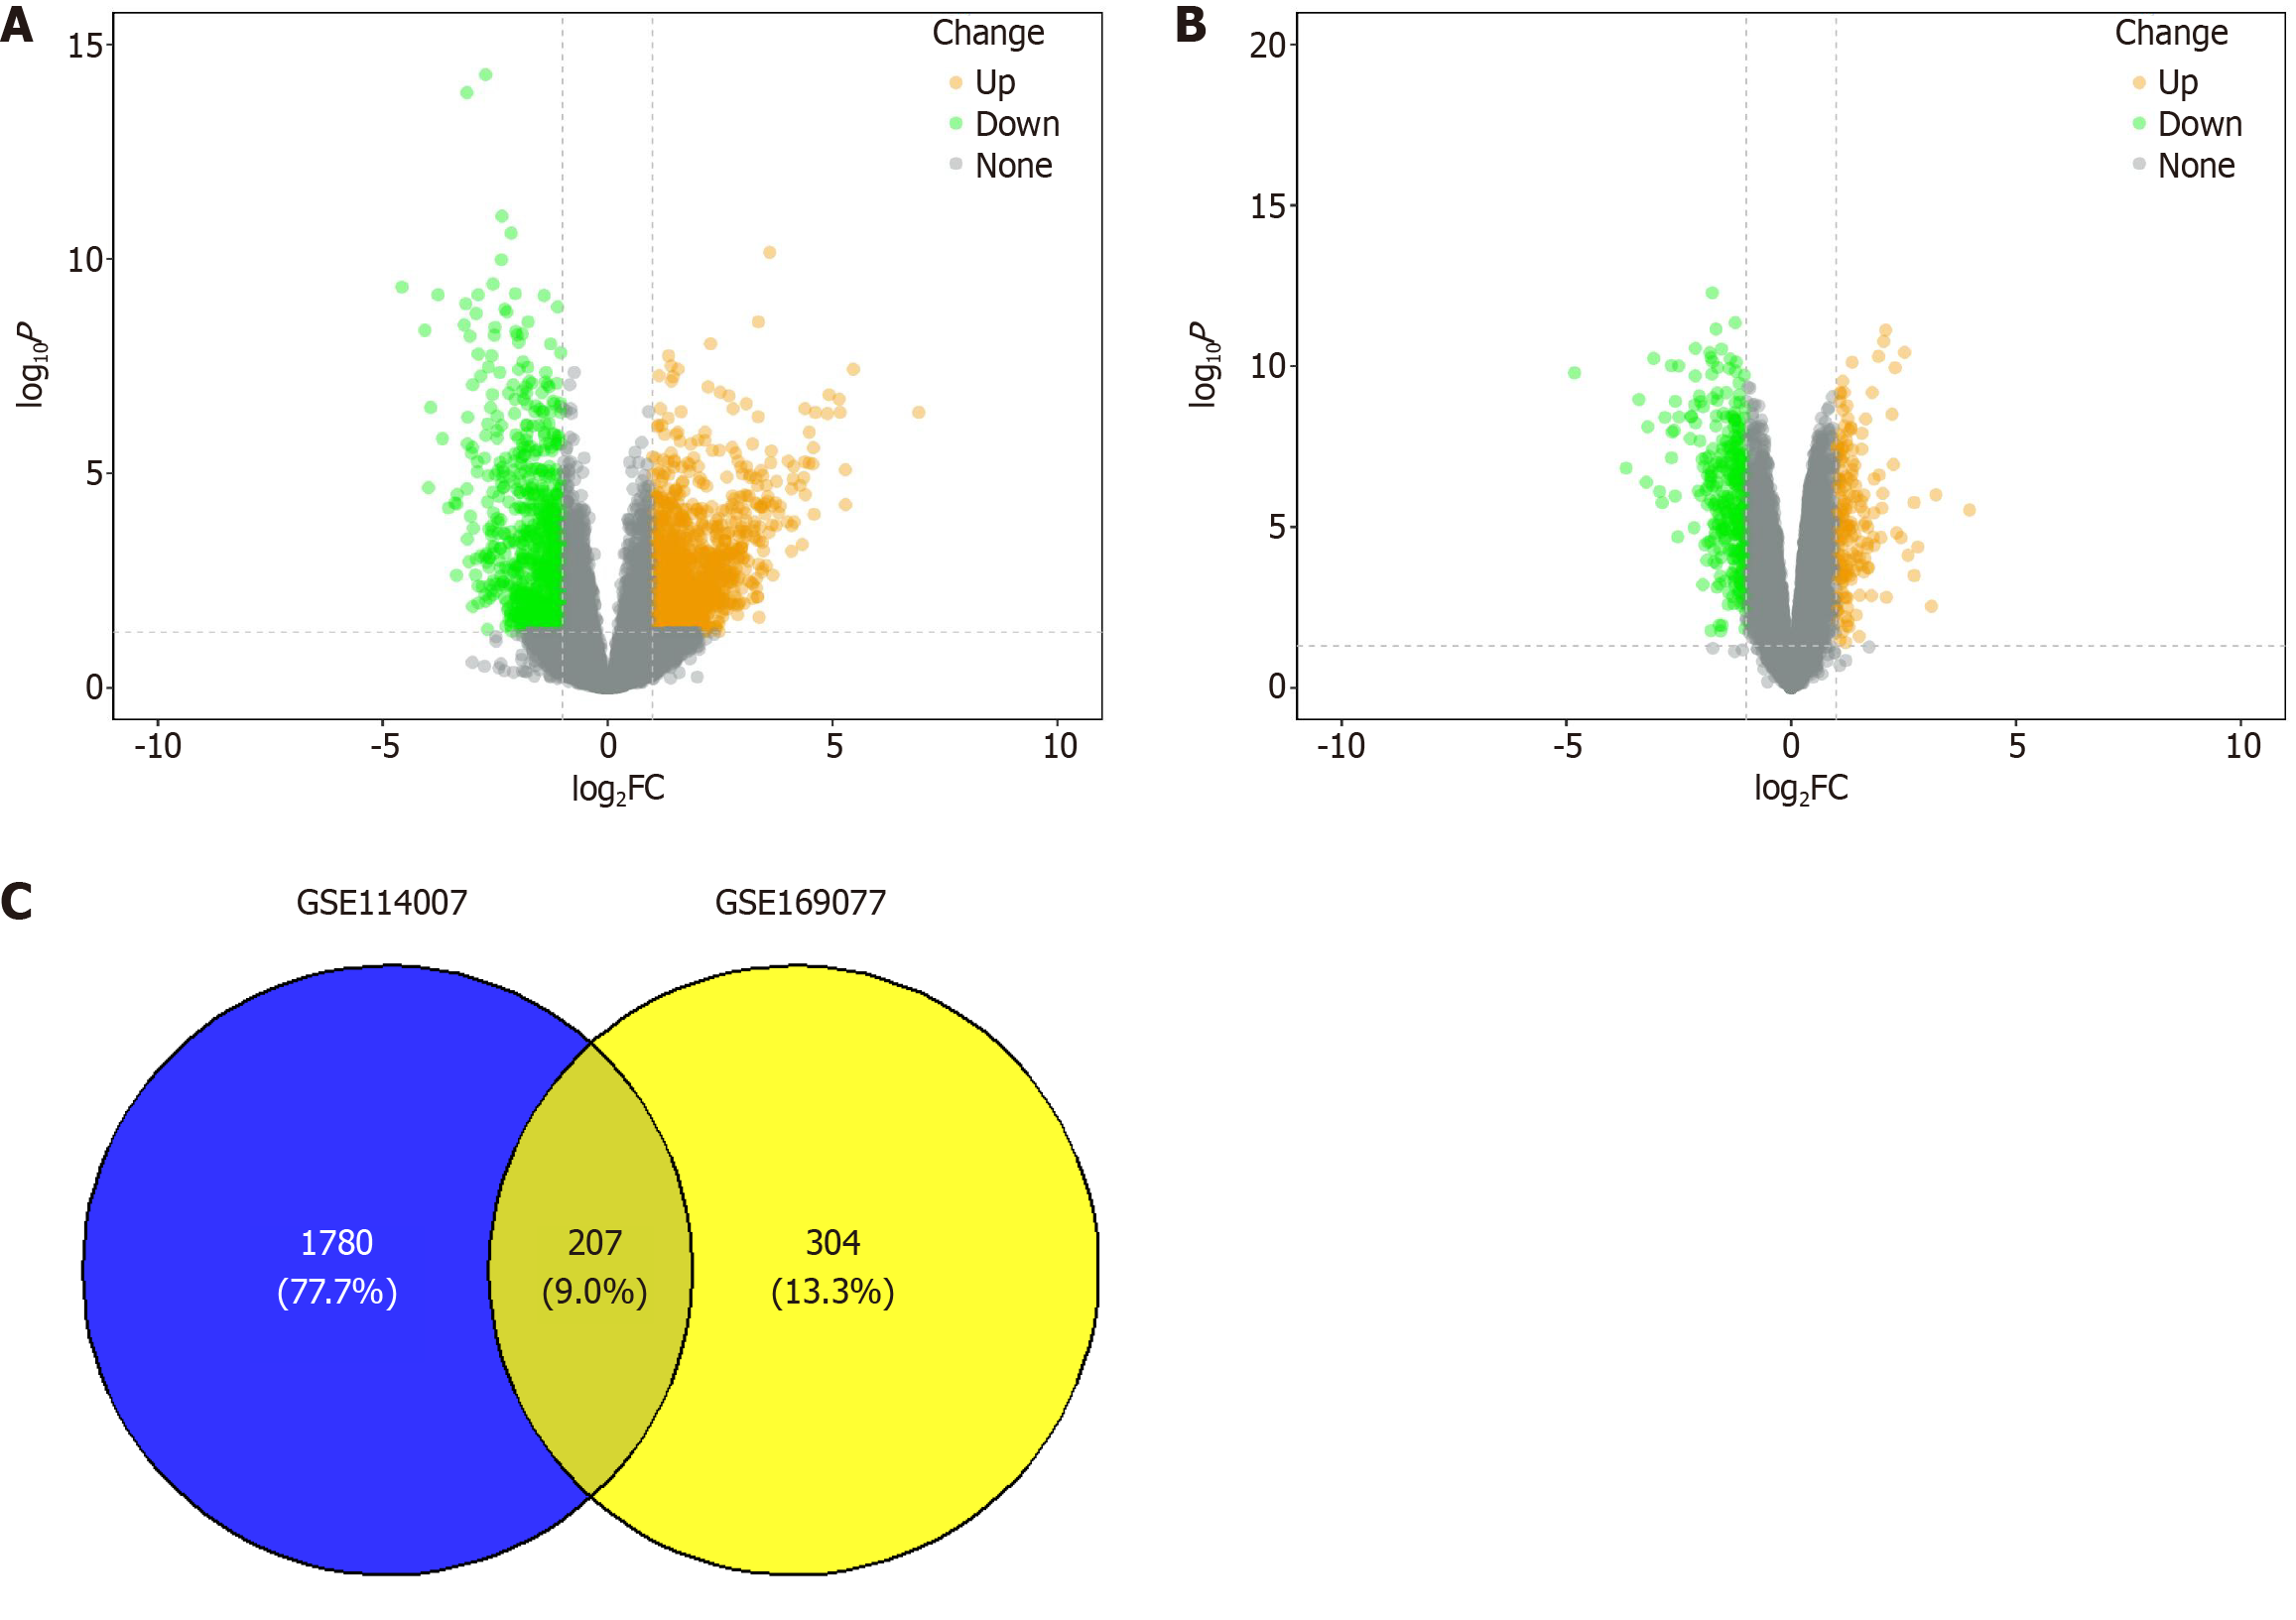
Figure 1 Identification of differentially expressed genes in osteoarthritis cartilage tissue.
A: Volcano plot illustrating differentially expressed genes (DEGs) from the GSE169077 dataset, highlighting the significance and fold change of gene expression; B: Volcano plot depicting DEGs from the GSE114007 dataset, providing a visual summary of the statistical significance and magnitude of changes in gene expression; C: Venn diagram showing the intersection of DEGs identified in both the GSE169077 and GSE114007 datasets, indicating the common genes that are differentially expressed across the two studies. FC: Fold change.
- Citation: Xiang CH, Zou L, Huang ZG, Zhang GJ, Zeng HL, He ZX, Dai ZS. Synovial mesenchymal stem cell-derived exosomes delivering GRPEL1 activate PINK1-mediated mitophagy to promote cartilage repair in arthritis. World J Stem Cells 2025; 17(10): 109369
- URL: https://www.wjgnet.com/1948-0210/full/v17/i10/109369.htm
- DOI: https://dx.doi.org/10.4252/wjsc.v17.i10.109369