Copyright
©The Author(s) 2024.
World J Stem Cells. Apr 26, 2024; 16(4): 410-433
Published online Apr 26, 2024. doi: 10.4252/wjsc.v16.i4.410
Published online Apr 26, 2024. doi: 10.4252/wjsc.v16.i4.410
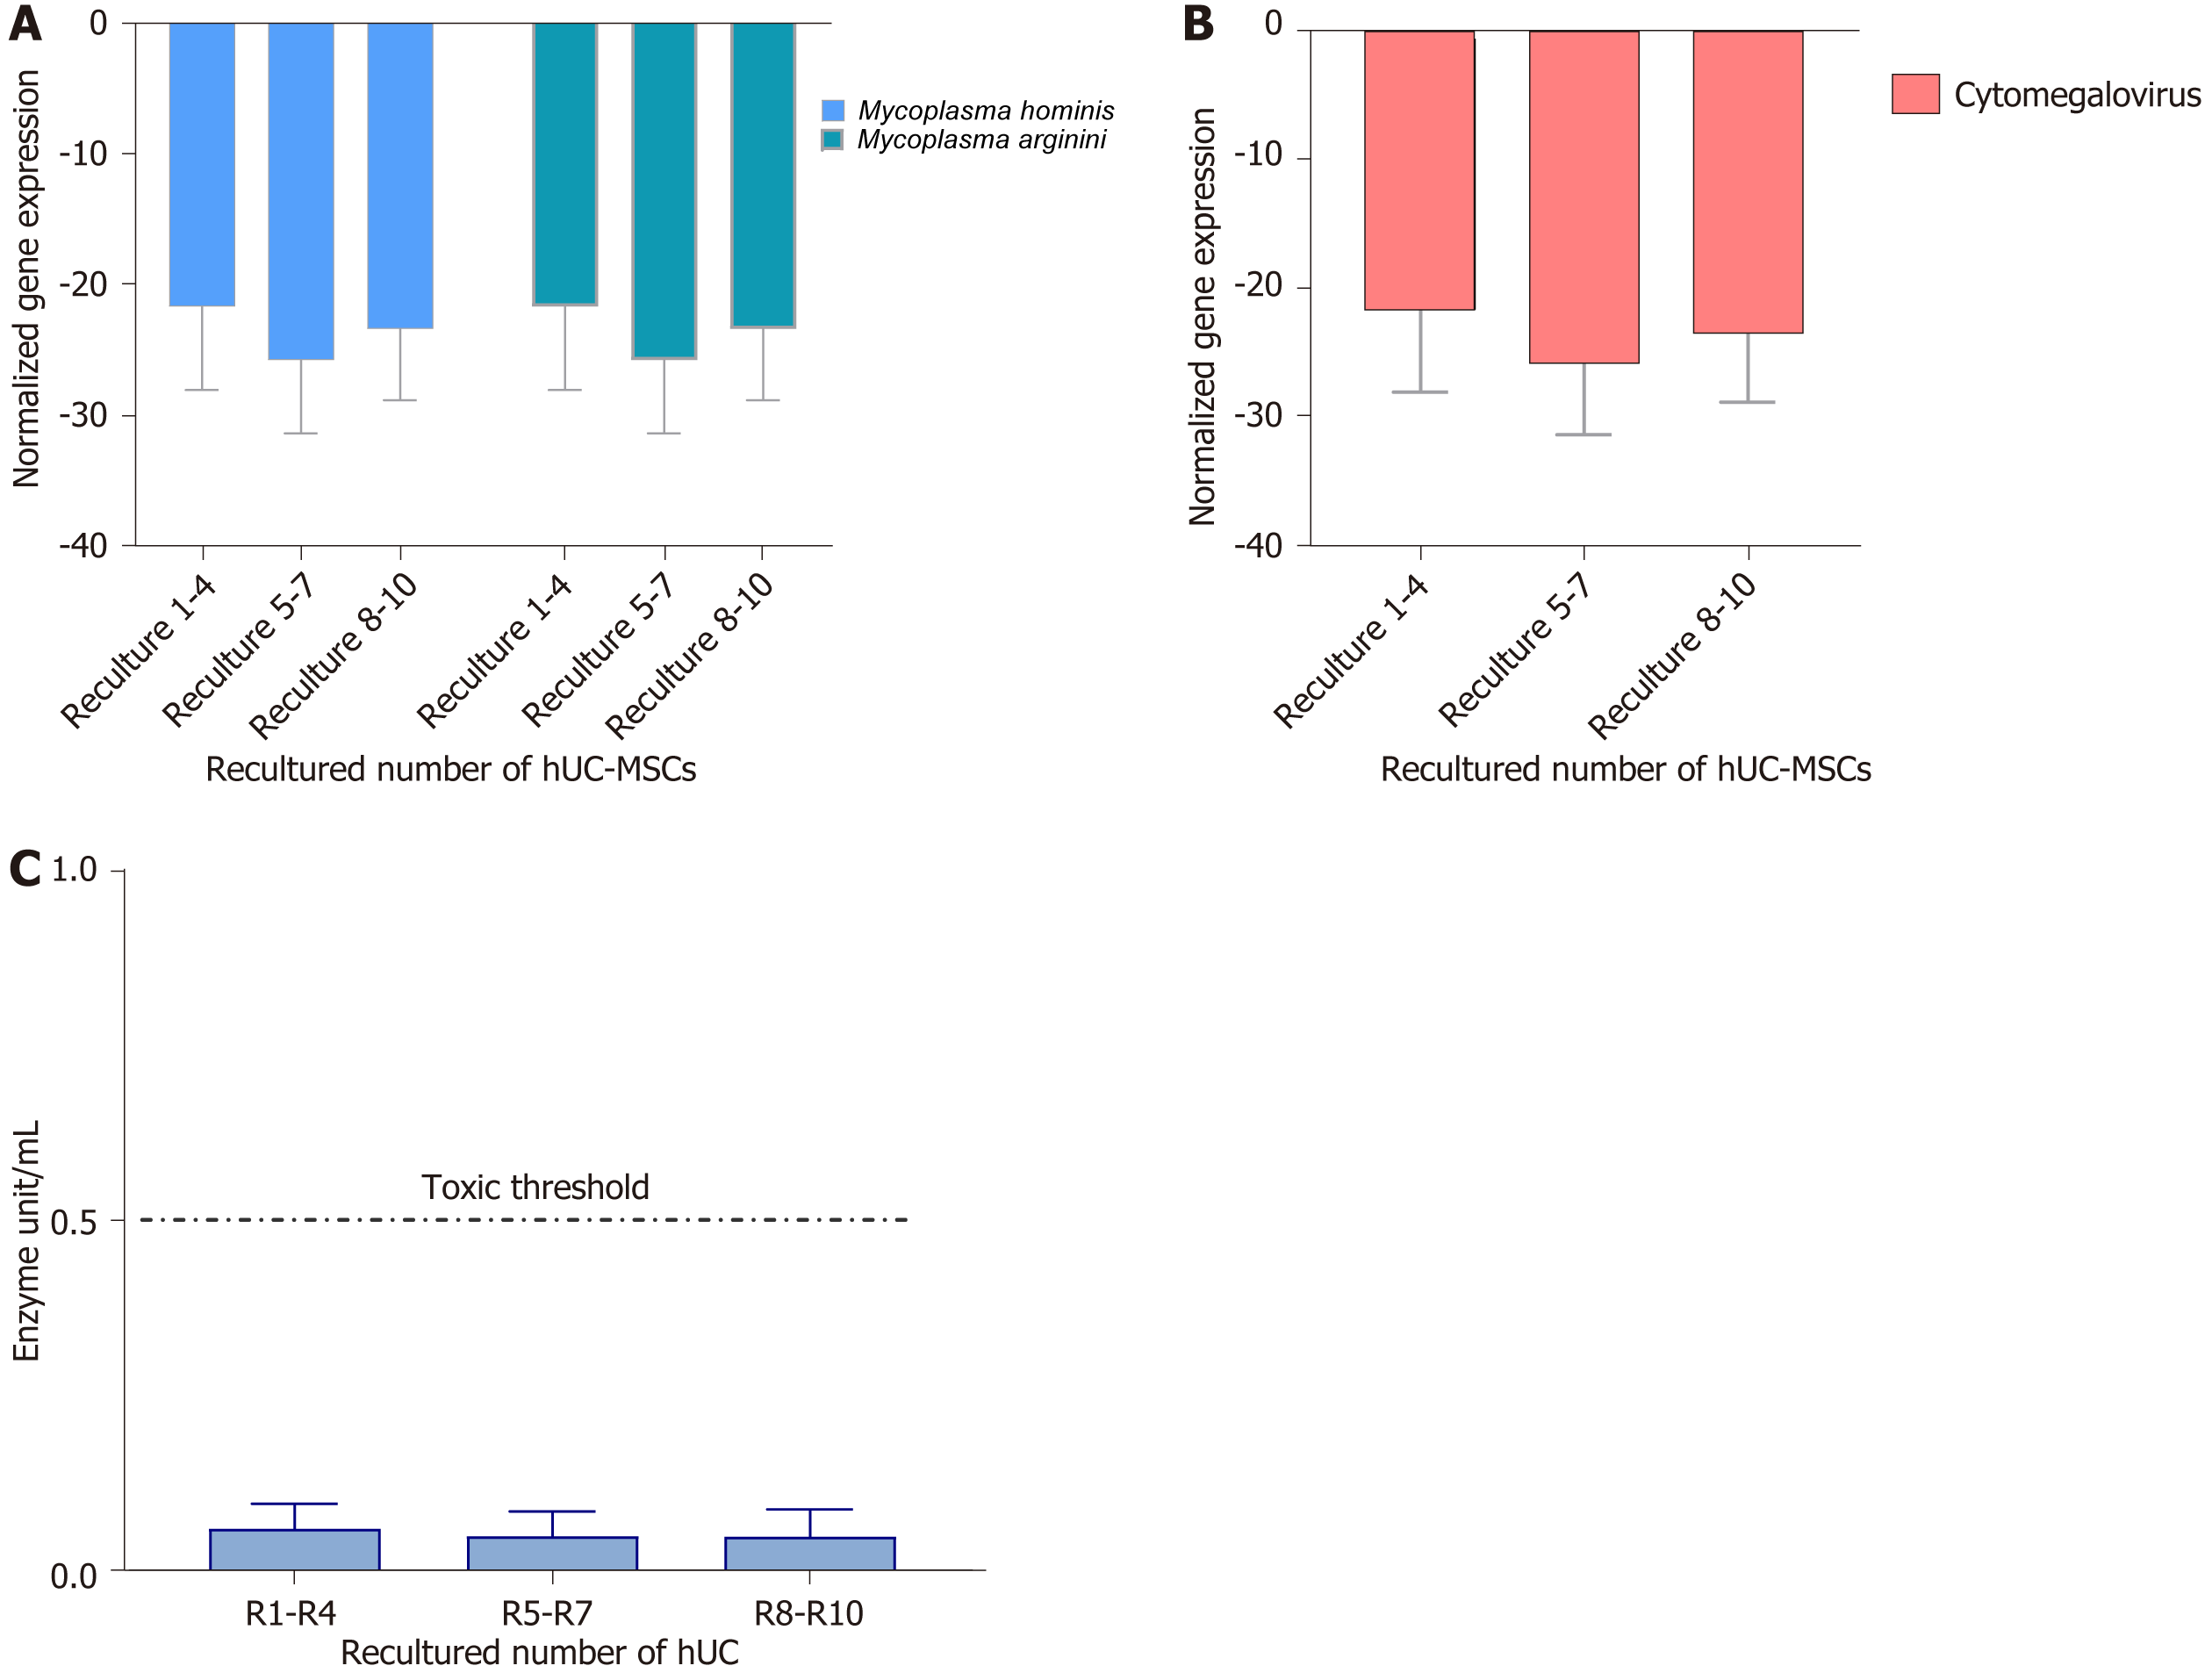
Figure 13 Mycoplasma, cytomegalovirus, and endotoxin analysis.
A and B: The normalized gene expression of mycoplasma and cytomegalovirus in recultured human umbilical cord-mesenchymal stem cells (hUC-MSCs): To evaluate the normalized gene expression of Mycoplasma hominis (M. hominis) and M. arginini and cytomegalovirus, quantification was performed by real-time polymerase chain reaction in triplicate at passages 1-6. The X-axis represents the MSCs derived from recultured hUC at three recultured ranges and the Y-axis represents M. hominis and M. arginini and cytomegalovirus expression normalized to housekeeping gene hydroxymethyl-bilane synthase. The expression at each recultured group showed negative expression of both strains of Mycoplasma. Values are presented as mean ± SD from six independent experiments. Statistically non-significant normalized expression was obtained; C: Recultured hUC-MSCs endotoxin analysis: The level of endotoxin in recultured hUC-MSC was measured by using the Pierce LAL Chromogenic Endotoxin Quantification Kit. The concentration of endotoxin is below 0.5 EU/mL. hUC: Human umbilical cord; MSC: Mesenchymal stem cell.
- Citation: Rajput SN, Naeem BK, Ali A, Salim A, Khan I. Expansion of human umbilical cord derived mesenchymal stem cells in regenerative medicine. World J Stem Cells 2024; 16(4): 410-433
- URL: https://www.wjgnet.com/1948-0210/full/v16/i4/410.htm
- DOI: https://dx.doi.org/10.4252/wjsc.v16.i4.410


