Copyright
©The Author(s) 2024.
World J Stem Cells. Mar 26, 2024; 16(3): 267-286
Published online Mar 26, 2024. doi: 10.4252/wjsc.v16.i3.267
Published online Mar 26, 2024. doi: 10.4252/wjsc.v16.i3.267
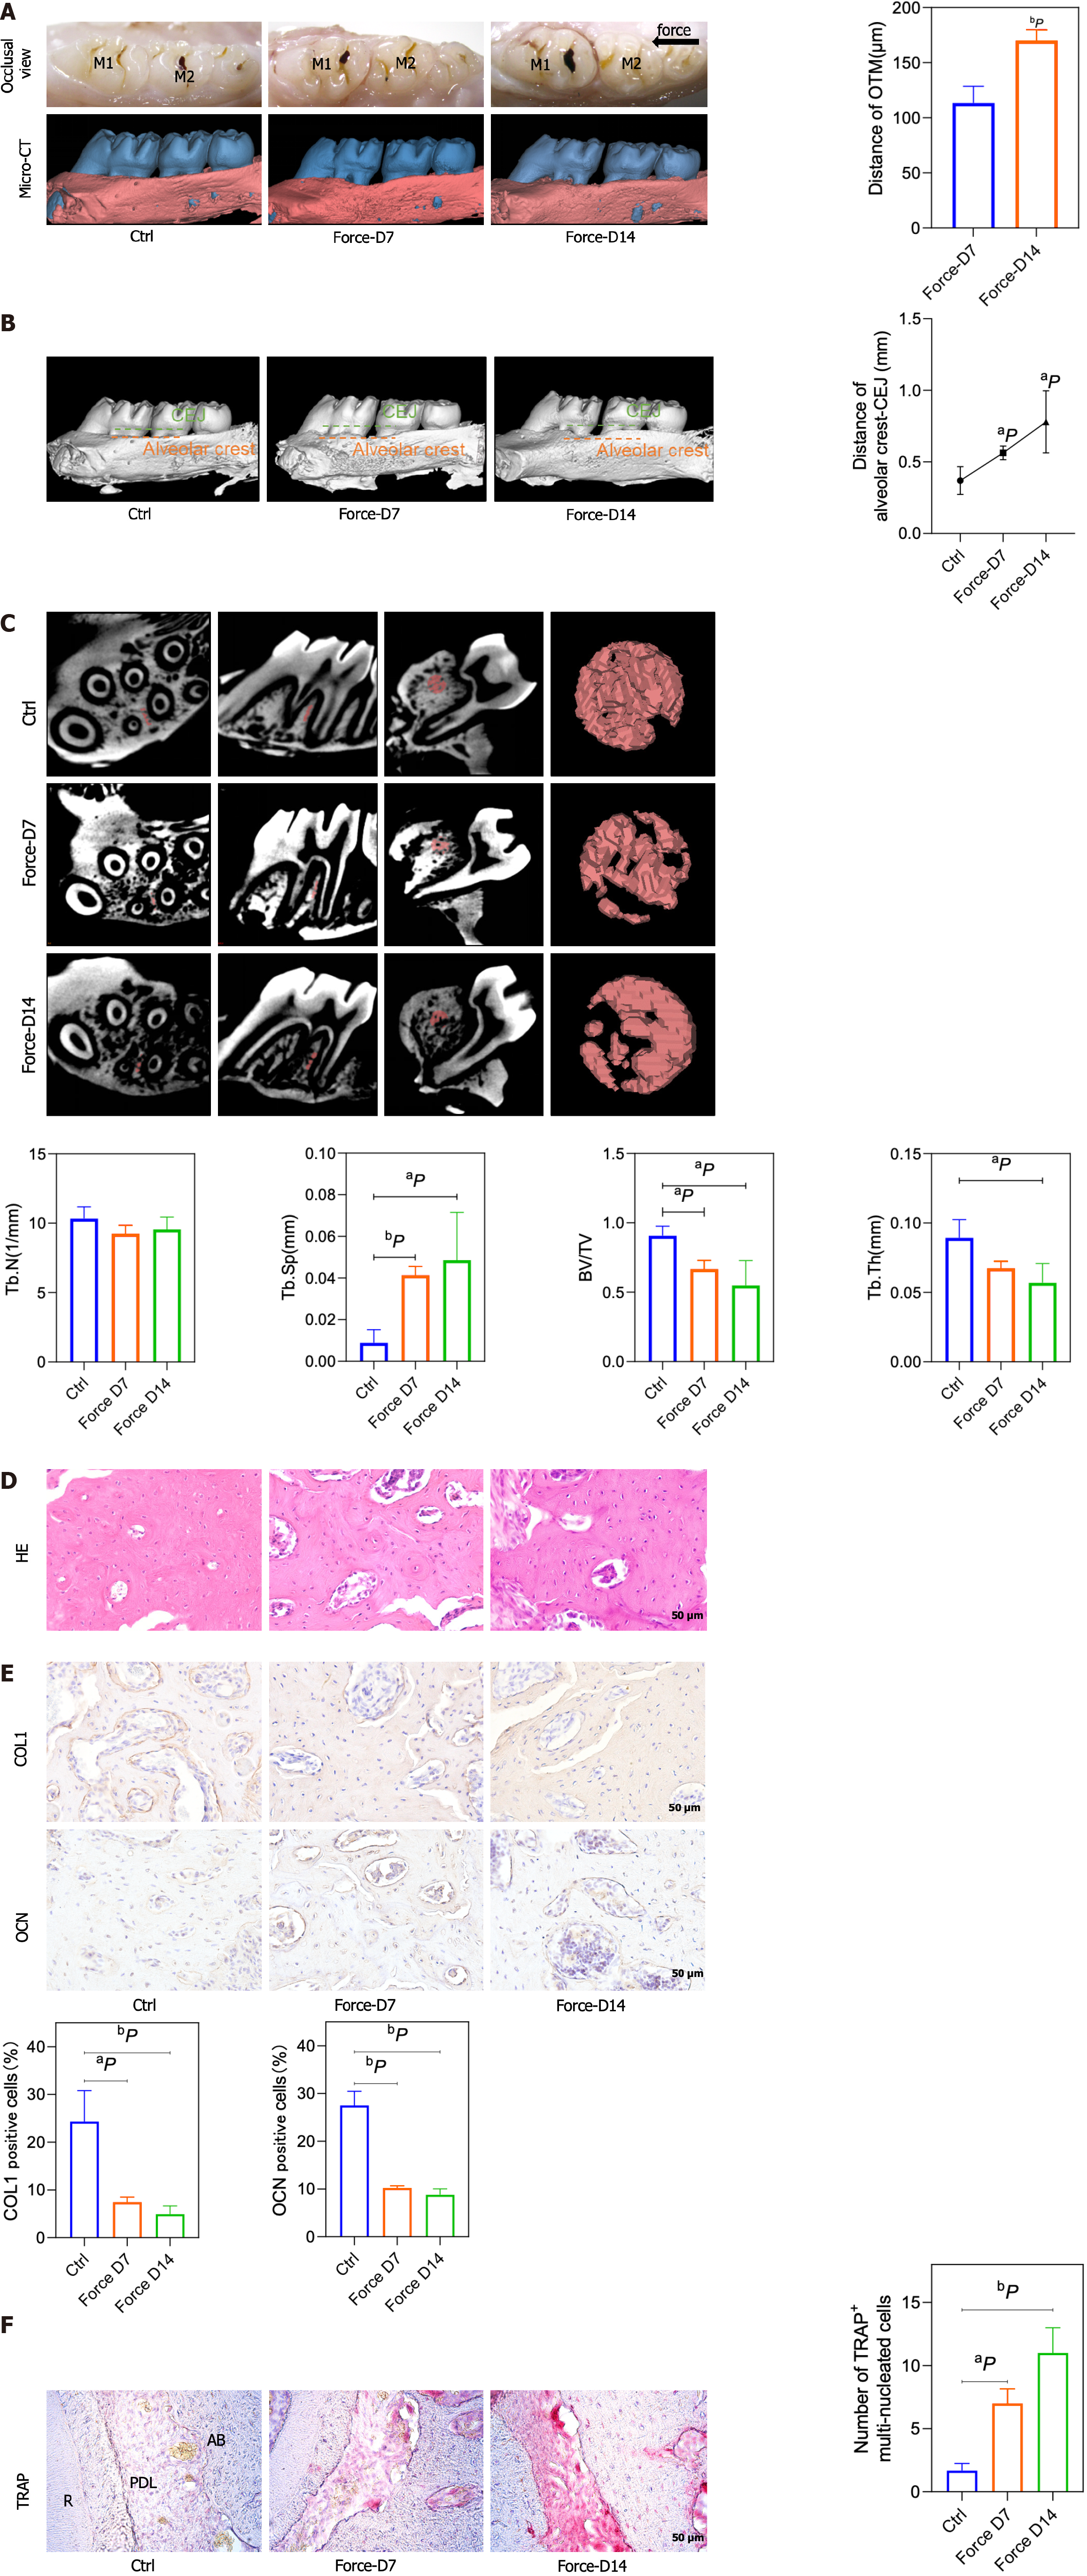
Figure 1 The bone density decreased, and the alveolar bone height decreased on the compression side.
A: Representative pictures of the rat tooth movement model and 3D model images reconstructed with Mimics software (left) and the statistical diagram of the tooth movement distance (right); B: Representative images of 3D models reconstructed from micro-computed tomography images showing the distance from the alveolar crest to the cemento-enamel junction (left) and the corresponding statistical analysis (right); C: Representative region of interest (ROI) selection diagrams (left) and statistical analysis (right). A certain volume of alveolar bone on the compressed side of the middle 1/2 root of the distal buccal root of the first molar was selected for subsequent analysis. The statistical analysis of the BV/TV, Tb.Th, Tb.N, Tb.Sp and BS/BV values of the ROI region was performed with Siemens software; D: Representative images of hematoxylin and eosin staining; E: Representative images of immunohistochemical staining for type 1 collagen and osteocalcin (left) and quantitative analyses (right); F: Representative images of tartrate-resistant acid phosphatase (TRAP) staining (left) and counting of TRAP-positive multinuclear (> 3 nuclei) cells (right). aP < 0.05 vs control group, bP < 0.01 vs control group. CEJ: Cementum-enamel boundary; HE: Hematoxylin and eosin; TRAP: Tartrate-resistant acid phosphatase; COL1: Type 1 collagen; OCN: Osteocalcin; CT: Computed tomography.
- Citation: Wu T, Zheng F, Tang HY, Li HZ, Cui XY, Ding S, Liu D, Li CY, Jiang JH, Yang RL. Low-intensity pulsed ultrasound reduces alveolar bone resorption during orthodontic treatment via Lamin A/C-Yes-associated protein axis in stem cells. World J Stem Cells 2024; 16(3): 267-286
- URL: https://www.wjgnet.com/1948-0210/full/v16/i3/267.htm
- DOI: https://dx.doi.org/10.4252/wjsc.v16.i3.267


