Copyright
©The Author(s) 2023.
World J Stem Cells. Jul 26, 2023; 15(7): 751-767
Published online Jul 26, 2023. doi: 10.4252/wjsc.v15.i7.751
Published online Jul 26, 2023. doi: 10.4252/wjsc.v15.i7.751
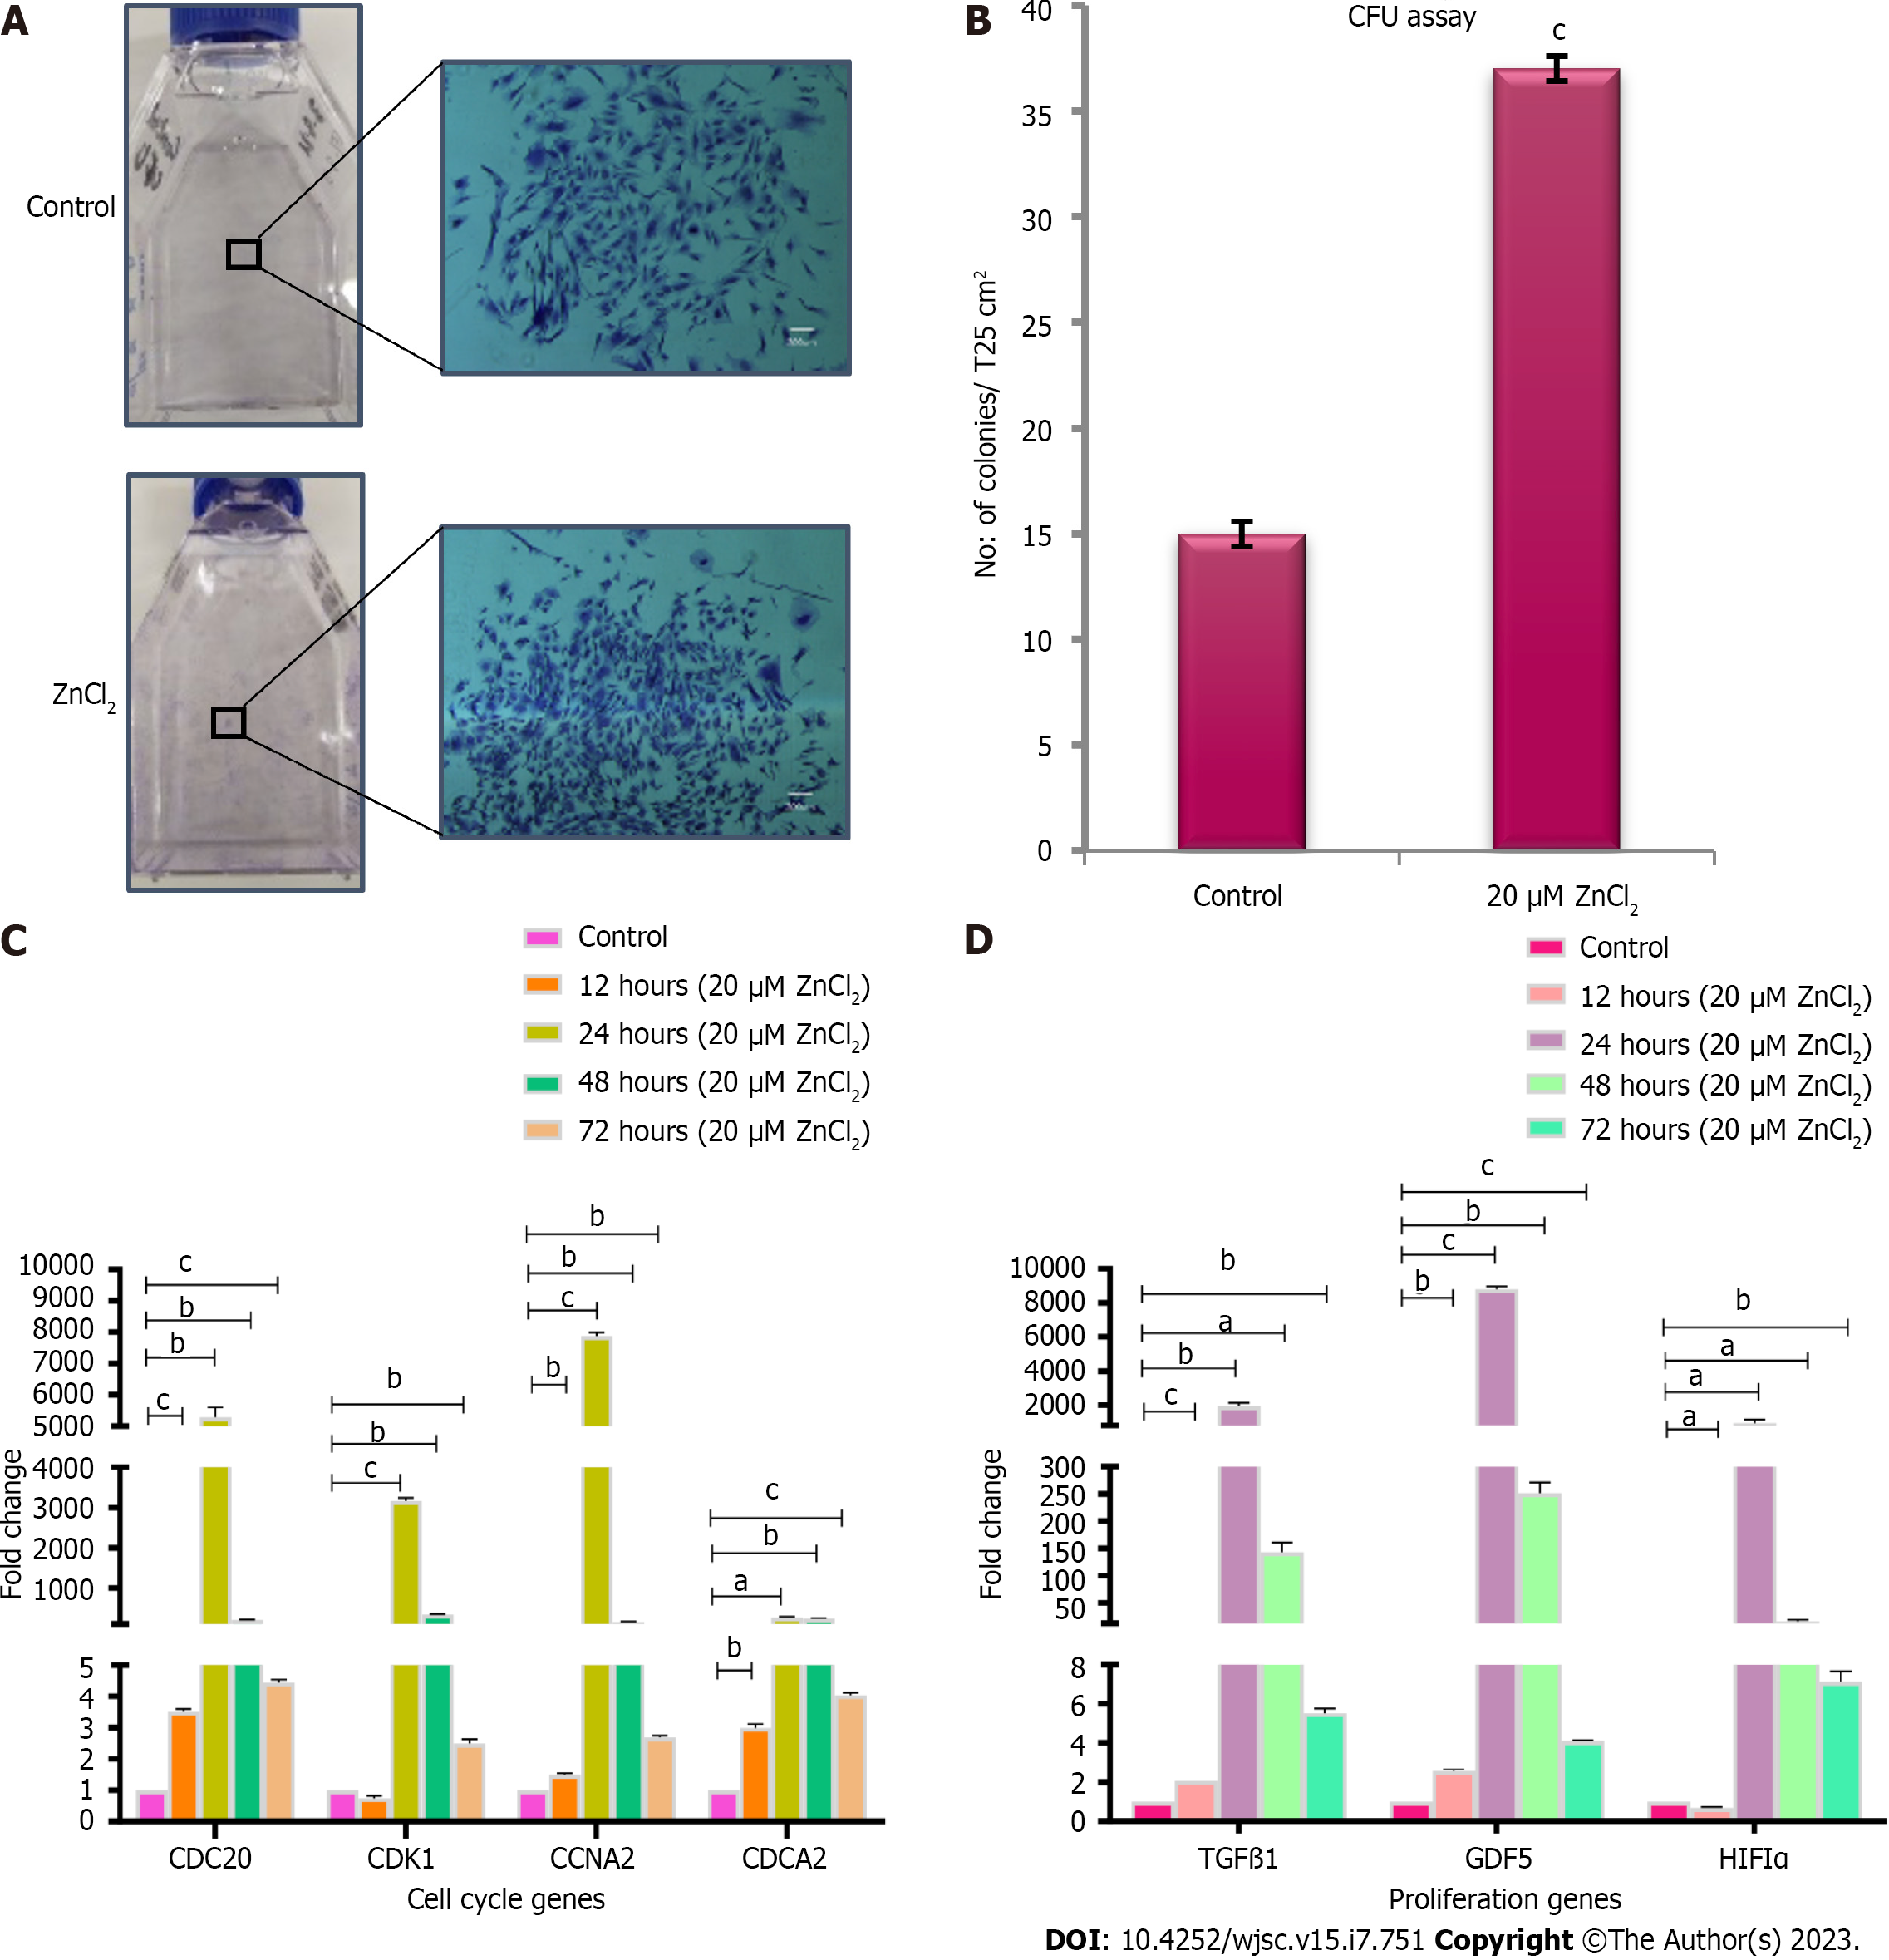
Figure 4 Colony forming unit assay and transcriptional analysis of cell cycle and proliferation genes.
A: Colonies after crystal violet staining in control and test groups. Denser colonies were observed in ZnCl2 treated group. Images were captured at 4 × magnification; B: A significantly higher number (cP ≤ 0.001) of colonies was observed in ZnCl2 treated group with a mean number of 37 ± 0.57 colonies per T25 flask as compared to control i.e., 15 ± 0.57 colonies per T25 flask. Results were analyzed by SPSS, performing an independent sample t-Test. C: Gene expression of cell cycle genes CDC20, CCNA2, CDCA2 was significantly increased in the test group after 12, 24, 48, and 72 h of treatment with 20 µM ZnCl2. No significant difference was found in CDK1 gene expression after 12, but it was significantly enhanced after 24, 48, and 72 h. This fold change (2-ΔΔCt) increase in genes expression was highest in the 24-h group. D: Gene expression of proliferation genes transforming growth factor β1 and GDF5 were significantly increased in all temporal groups i.e. 12, 24, 48, and 72 h, of 20 µM ZnCl2. HIF1α significantly decreased after 12 h but then significantly increased after 24, 48, and 72 h. Results were analyzed by SPSS, performing an independent sample t-Test. Data was represented as mean ± SD (n = 3) where significance level aP ≤ 0.05 (aP ≤ 0.05, bP ≤ 0.01, cP ≤ 0.001).
- Citation: Sahibdad I, Khalid S, Chaudhry GR, Salim A, Begum S, Khan I. Zinc enhances the cell adhesion, migration, and self-renewal potential of human umbilical cord derived mesenchymal stem cells. World J Stem Cells 2023; 15(7): 751-767
- URL: https://www.wjgnet.com/1948-0210/full/v15/i7/751.htm
- DOI: https://dx.doi.org/10.4252/wjsc.v15.i7.751


