Copyright
©The Author(s) 2023.
World J Stem Cells. Jun 26, 2023; 15(6): 589-606
Published online Jun 26, 2023. doi: 10.4252/wjsc.v15.i6.589
Published online Jun 26, 2023. doi: 10.4252/wjsc.v15.i6.589
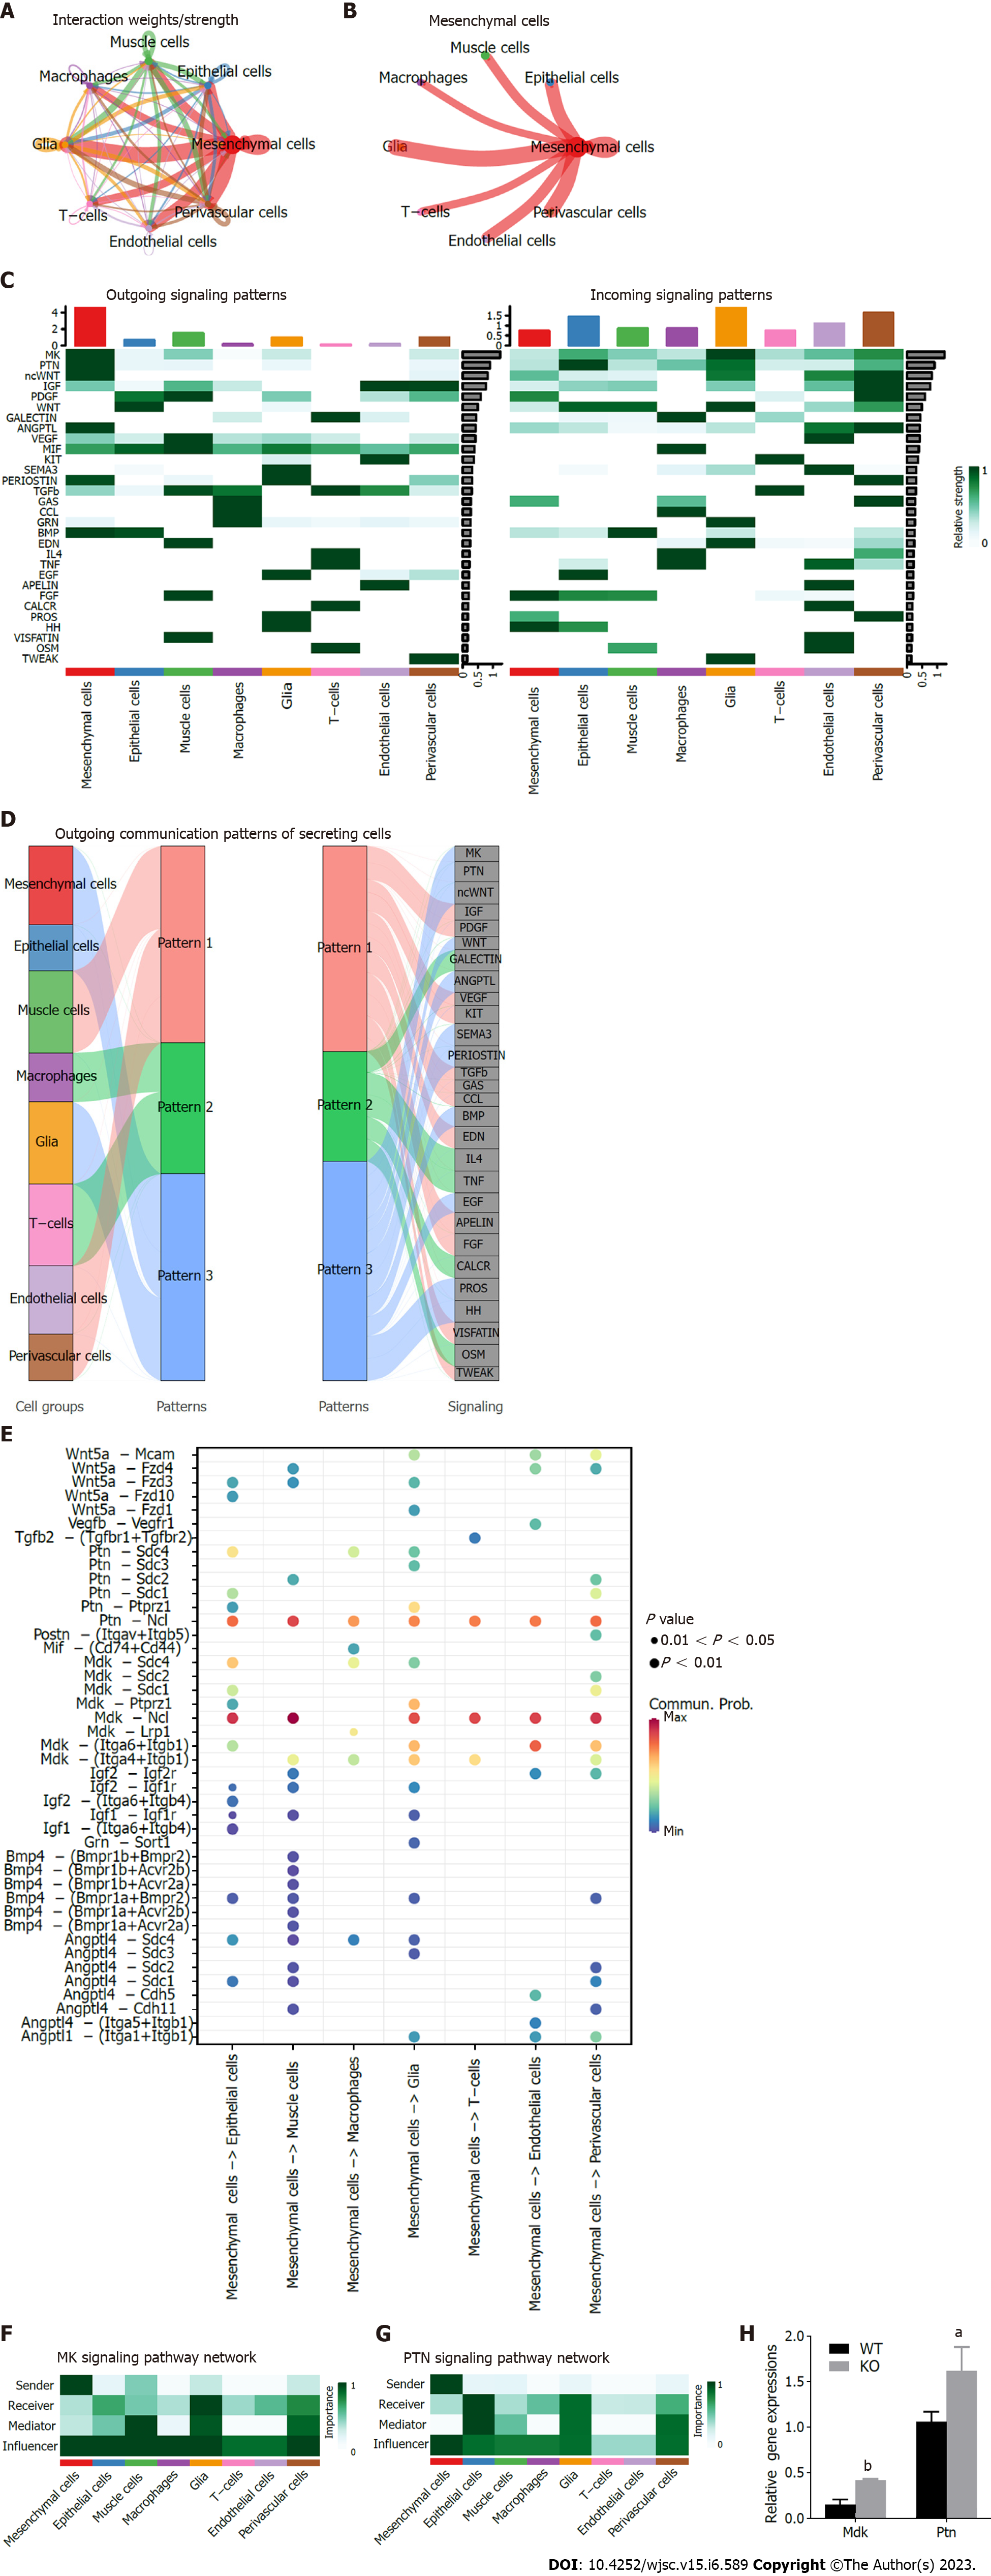
Figure 6 Inference, analysis and visualization of cellular communication networks from a single dataset via CellChat.
A: Interaction intensity plot between cells in single cell sequence profiling; B: Interaction intensity map between mesenchymal stem cells (MSCs) and other cell types; C: Contribution map of 30 signaling pathways detected by CellChat to intercellular efferent (or afferent) signaling; D: Alluvial plot of cell outgoing signaling patterns, showing the correspondence between cell populations and signaling pathways; E: Important ligand–receptor pairs for MSCs sending signals to other cell types. F and G: Contribution of efferent (or afferent) signals between cells, the MK signaling pathway (F) and PTN signaling pathway (G) were selected for visualization of network centrality scores; H: Expression of Mdk and Ptn in Cd271 knockout and wild-type MSCs was analyzed by quantitative real-time polymerase chain reaction. Data are presented as mean values ± SD (n = 3 biologically independent experiments. Two-sided unpaired t-test, aP < 0.05, bP < 0.01). KO: Knockout; WT: Wild-type.
- Citation: Zhang YY, Li F, Zeng XK, Zou YH, Zhu BB, Ye JJ, Zhang YX, Jin Q, Nie X. Single cell RNA sequencing reveals mesenchymal heterogeneity and critical functions of Cd271 in tooth development. World J Stem Cells 2023; 15(6): 589-606
- URL: https://www.wjgnet.com/1948-0210/full/v15/i6/589.htm
- DOI: https://dx.doi.org/10.4252/wjsc.v15.i6.589


