Copyright
©The Author(s) 2023.
World J Stem Cells. Jun 26, 2023; 15(6): 589-606
Published online Jun 26, 2023. doi: 10.4252/wjsc.v15.i6.589
Published online Jun 26, 2023. doi: 10.4252/wjsc.v15.i6.589
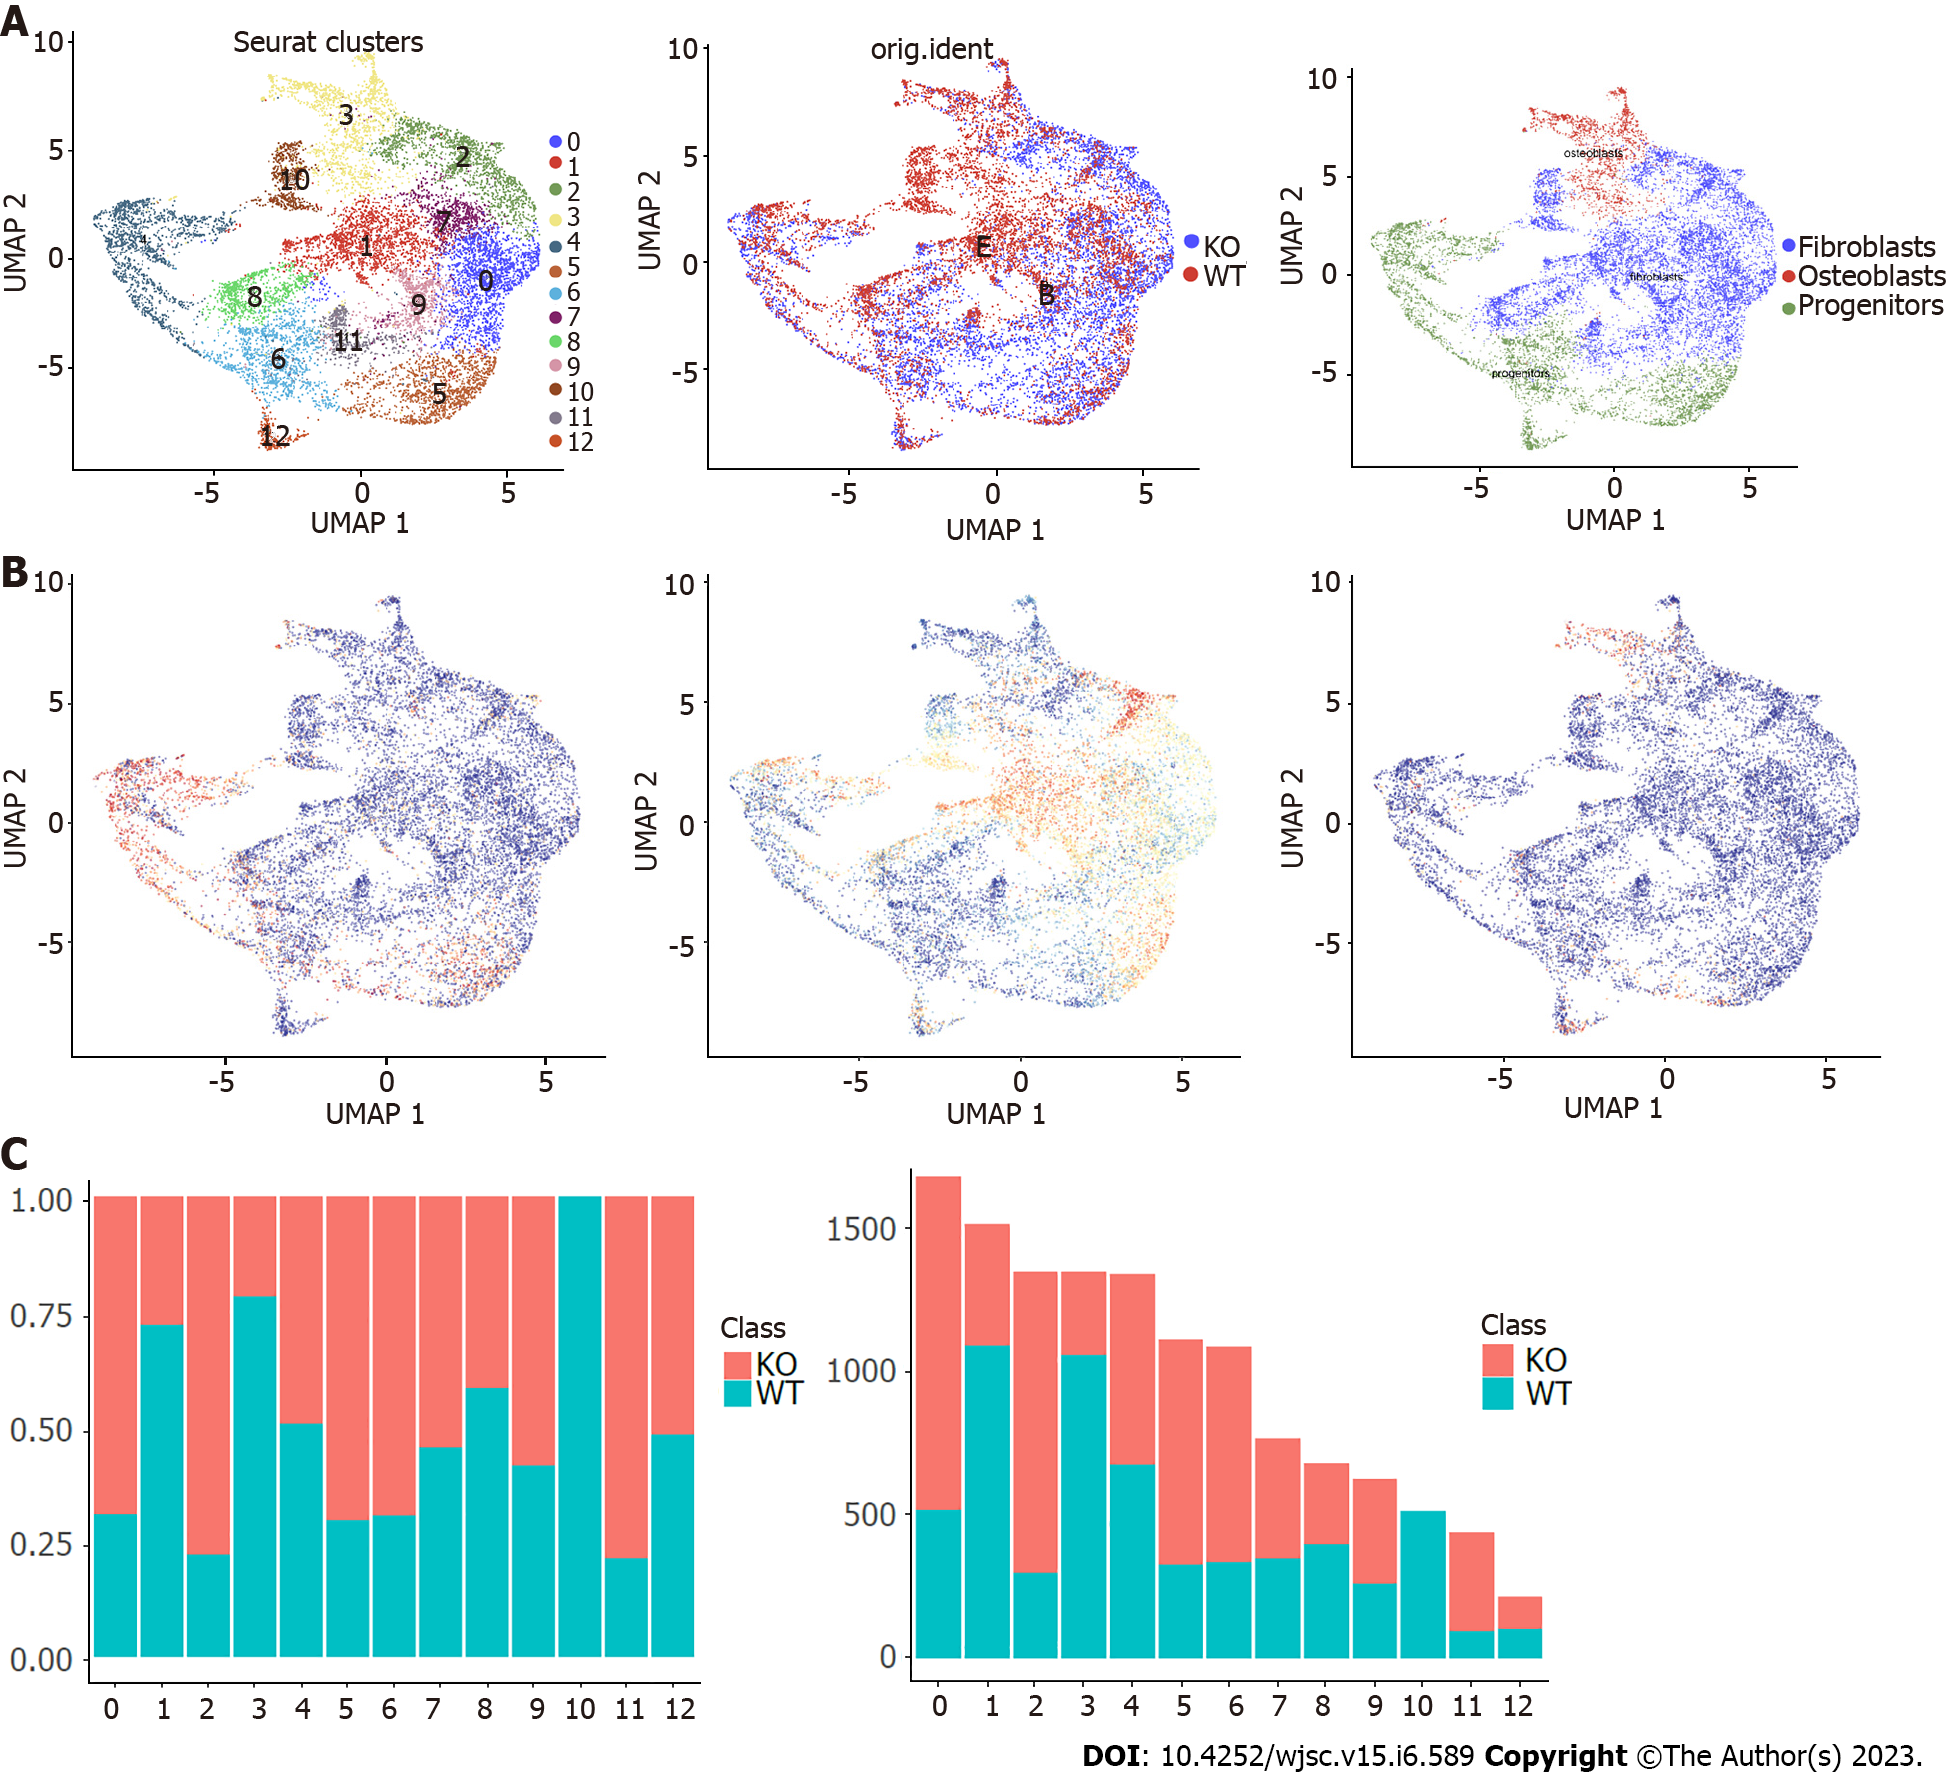
Figure 3 Further cluster analysis of mesenchymal stem cells.
A: Mesenchymal stem cells were reclustered and color-coded according to cluster, sample origin and cell type; B: Feature scores of progenitors, fibroblasts and osteoblasts marker genes were displayed in the Uniform Manifold Approximation and Projection plot; C: Histogram showing the proportion and the number of cells in each cluster of wild-type and Cd271 knockout mice. UMAP: Uniform Manifold Approximation and Projection; KO: Knockout; WT: Wild-type.
- Citation: Zhang YY, Li F, Zeng XK, Zou YH, Zhu BB, Ye JJ, Zhang YX, Jin Q, Nie X. Single cell RNA sequencing reveals mesenchymal heterogeneity and critical functions of Cd271 in tooth development. World J Stem Cells 2023; 15(6): 589-606
- URL: https://www.wjgnet.com/1948-0210/full/v15/i6/589.htm
- DOI: https://dx.doi.org/10.4252/wjsc.v15.i6.589


