Copyright
©The Author(s) 2022.
World J Stem Cells. Mar 26, 2022; 14(3): 245-263
Published online Mar 26, 2022. doi: 10.4252/wjsc.v14.i3.245
Published online Mar 26, 2022. doi: 10.4252/wjsc.v14.i3.245
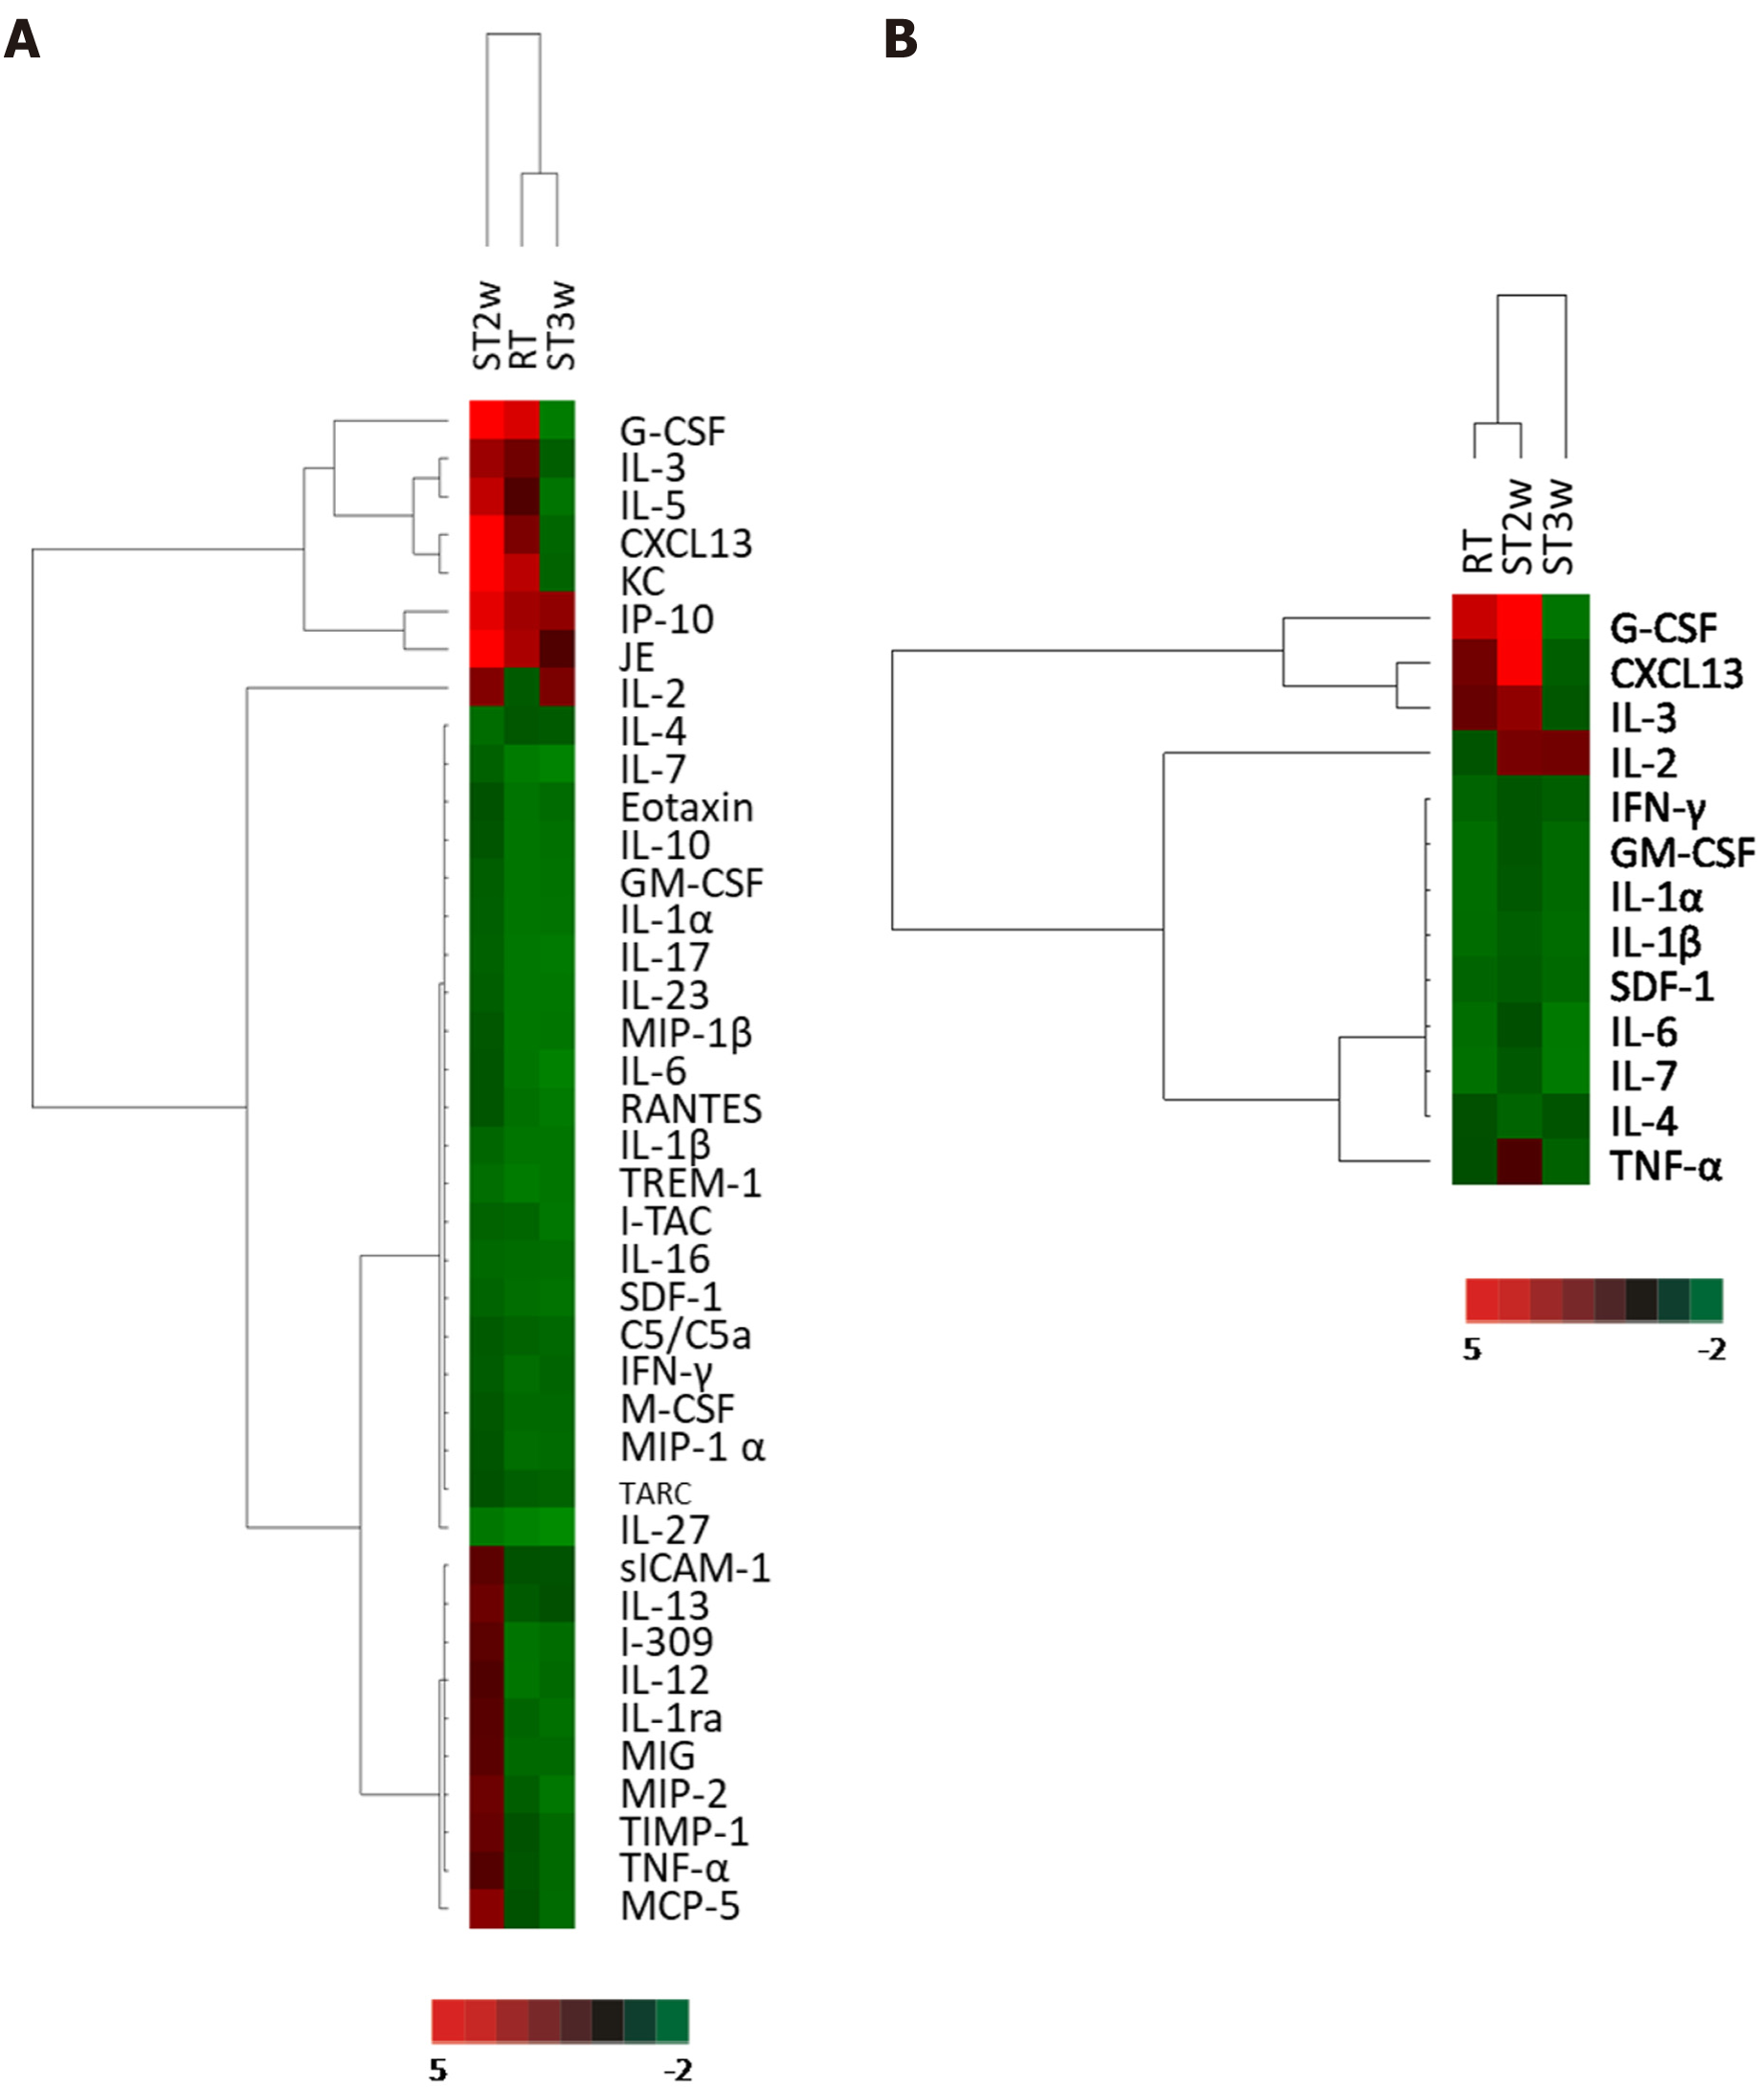
Figure 6 Clustering analysis of cytokine array from plasma samples.
A: Thirty-nine proteins in the plasma were investigated in normal control (NC) and irradiated (RT) groups at week 2 and the stem cell-treated (ST) group at weeks 2 and 3 (ST2w and ST3w, respectively). Proteins in the plasma of RT and ST groups were normalized to the NC group before comparison; B: The proteins with 1.5-fold higher expression in the three groups than in the NC group were selected and compared. NC: Normal control; ST: Stem cell-treated; RT: Irradiated; IL: Interleukin; TNF-α: Tumor necrotic factor-α; GM-CSF: Granulocyte-macrophage colony-stimulating factor; SDF-1: Stromal cell-derived factor 1; IFN: Interferon.
- Citation: Kim MJ, Moon W, Heo J, Lim S, Lee SH, Jeong JY, Lee SJ. Optimization of adipose tissue-derived mesenchymal stromal cells transplantation for bone marrow repopulation following irradiation. World J Stem Cells 2022; 14(3): 245-263
- URL: https://www.wjgnet.com/1948-0210/full/v14/i3/245.htm
- DOI: https://dx.doi.org/10.4252/wjsc.v14.i3.245


