Copyright
©The Author(s) 2021.
World J Stem Cells. Dec 26, 2021; 13(12): 1928-1946
Published online Dec 26, 2021. doi: 10.4252/wjsc.v13.i12.1928
Published online Dec 26, 2021. doi: 10.4252/wjsc.v13.i12.1928
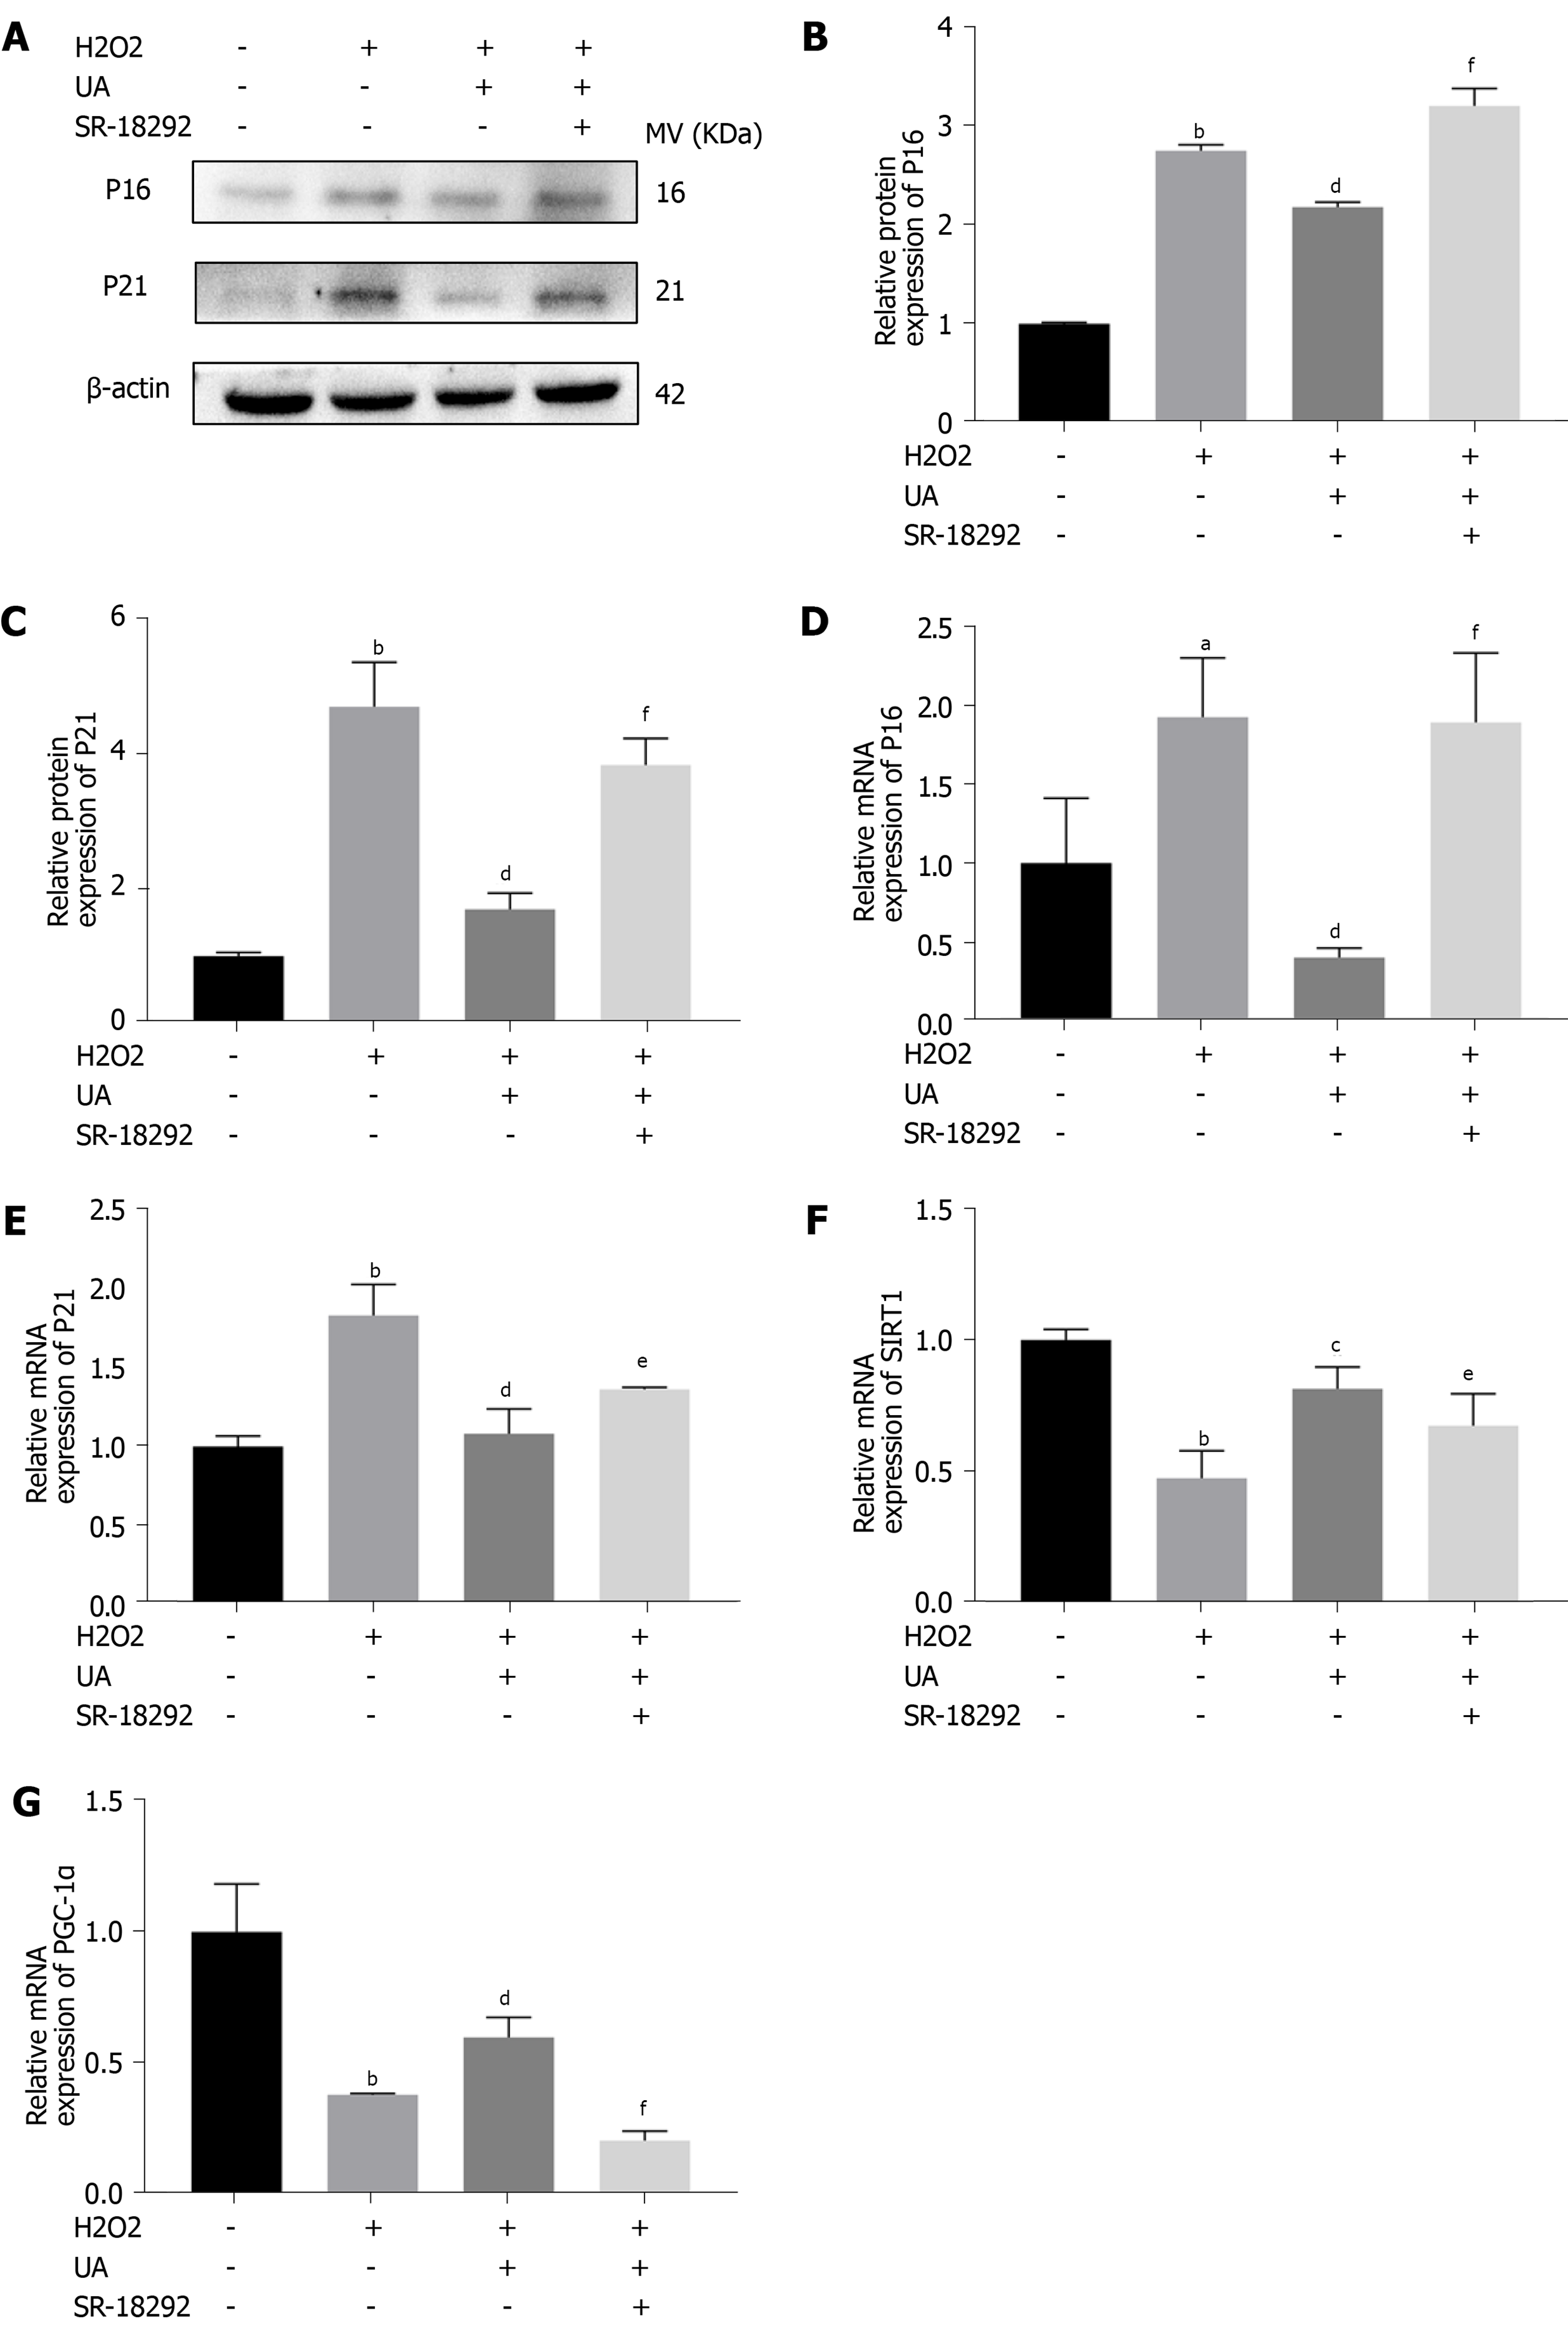
Figure 6 Senescence-related and SIRT1/PGC-1α pathway-related mRNA and proteins assay.
A: The expression of senescence-related proteins (P16 and P21) in different groups; B-C: Quantitative analysis of P16 and P21 protein expression results; D-E: Quantitative analysis of P16 and P21 mRNA expression results; F-G: Quantitative analysis SIRT1/PGC-1α pathway-related mRNA. All data are expressed as the mean ± SD. aP < 0.05, bP < 0.01 compared with control group; cP < 0.05, dP < 0.01 compared with H2O2 group; eP < 0.05, fP < 0.01 compared with H2O2 + UA group. SIRT1/PGC-1α: Silent information regulator of transcription 1/PPAR gamma coactivator-1α; UA: Urolithin A.
- Citation: Shi PZ, Wang JW, Wang PC, Han B, Lu XH, Ren YX, Feng XM, Cheng XF, Zhang L. Urolithin a alleviates oxidative stress-induced senescence in nucleus pulposus-derived mesenchymal stem cells through SIRT1/PGC-1α pathway. World J Stem Cells 2021; 13(12): 1928-1946
- URL: https://www.wjgnet.com/1948-0210/full/v13/i12/1928.htm
- DOI: https://dx.doi.org/10.4252/wjsc.v13.i12.1928


