Copyright
©The Author(s) 2021.
World J Stem Cells. Dec 26, 2021; 13(12): 1928-1946
Published online Dec 26, 2021. doi: 10.4252/wjsc.v13.i12.1928
Published online Dec 26, 2021. doi: 10.4252/wjsc.v13.i12.1928
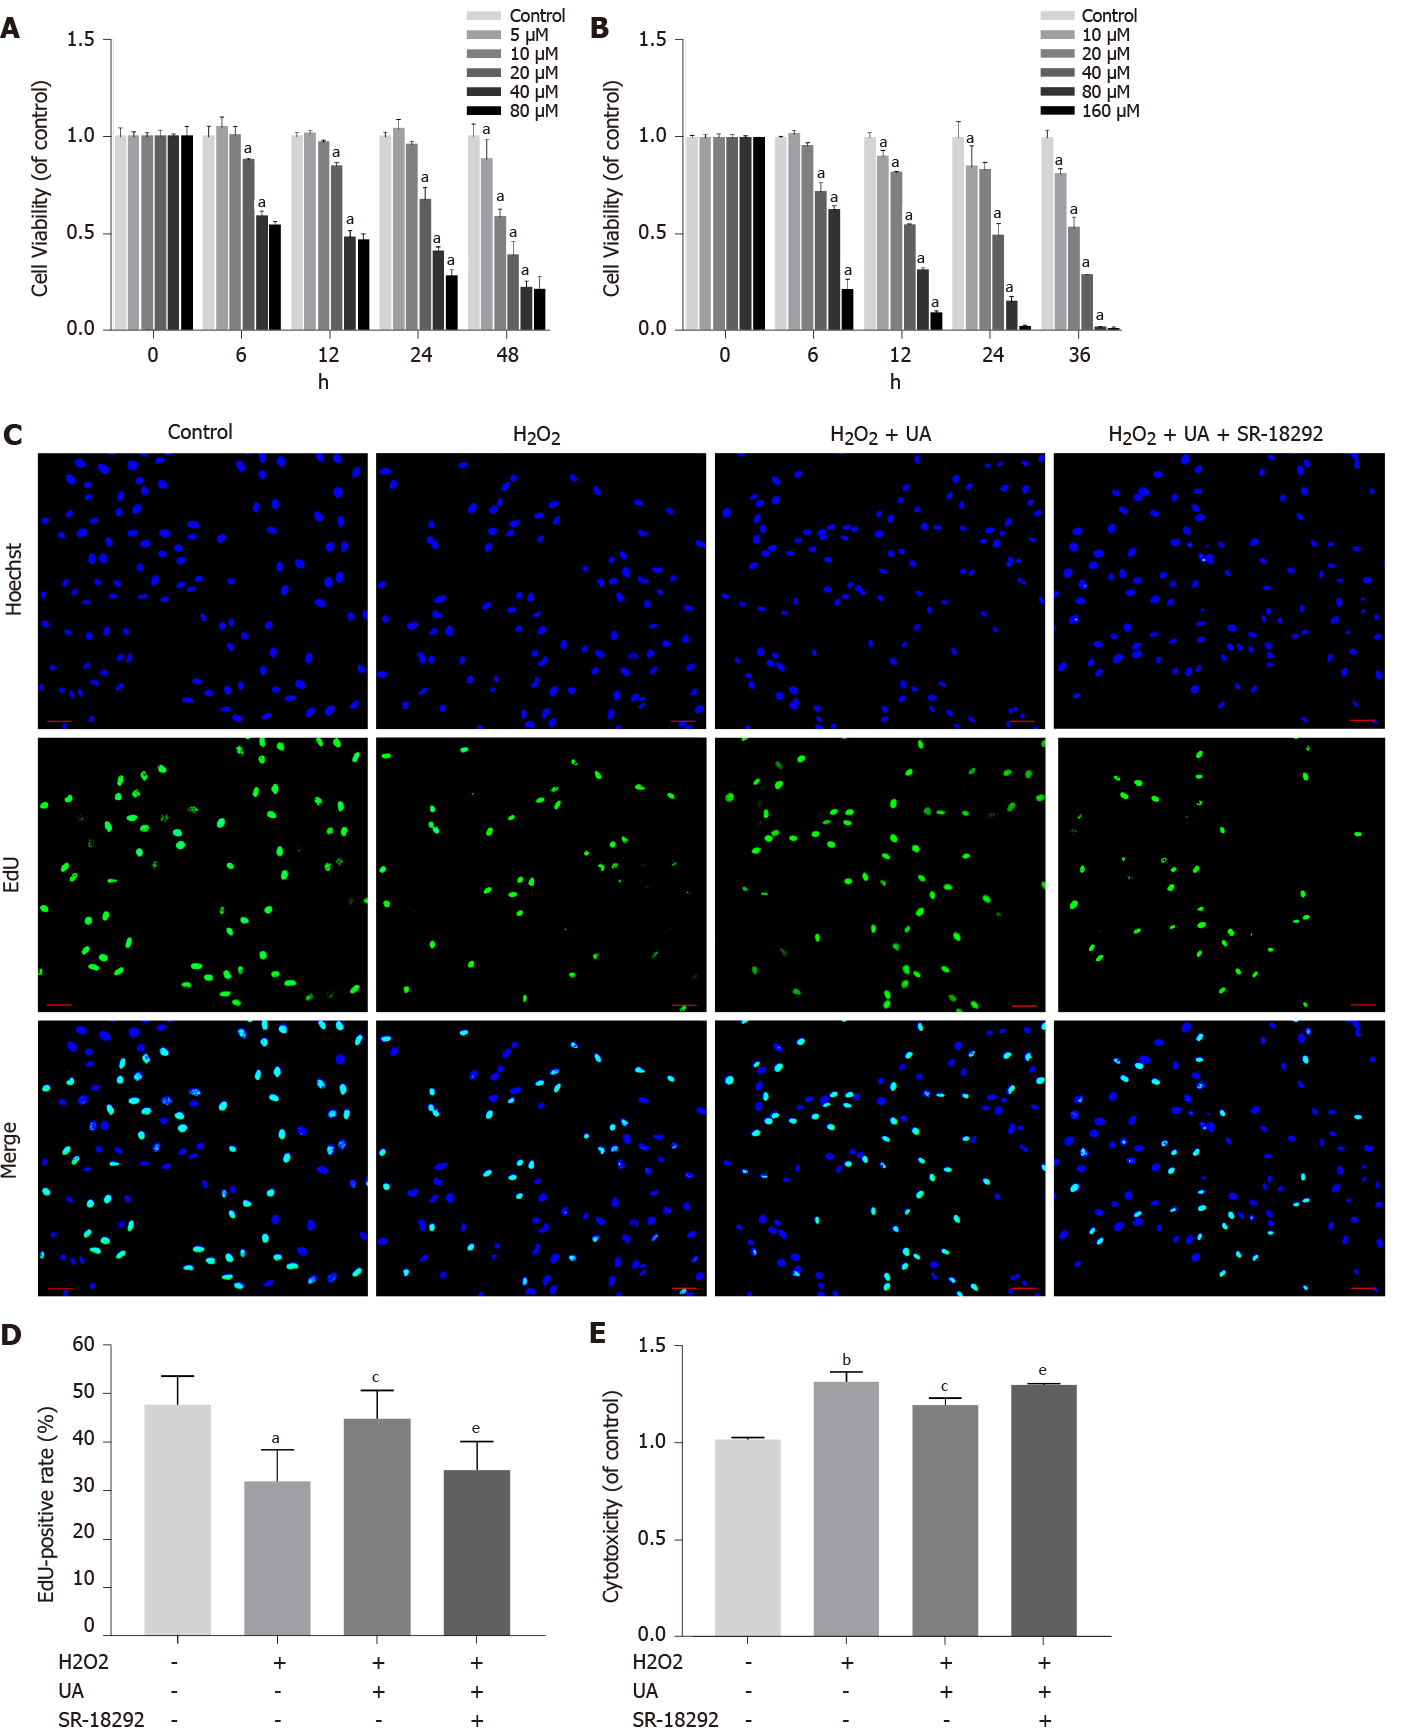
Figure 3 Cell viability assay, cell proliferation assay and cytotoxicity assay.
A: Cell counting kit-8 (CCK-8) results of nucleus pulposus-derived mesenchymal stem cells (NPMSCs) treated with different concentrations and times of urolithin A (UA); B: CCK-8 results of NPMSCs treated with different concentrations and times of SR-18292; C: EdU assay results of NPMSCs in different groups. Green fluorescence represents cells in a proliferating state, and blue fluorescence represents cell nucleus (scale bar = 25 μm); D: Quantitative analysis of EdU results; E: Cytotoxicity results of NPMSCs treated with H2O2, H2O2 + UA and H2O2 + UA + SR-18292. All data are expressed as the mean ± SD. aP < 0.05, bP < 0.01 compared with control group; cP < 0.05, dP < 0.01 compared with H2O2 group; eP < 0.05, fP < 0.01 compared with H2O2 + UA group. CCK-8: Cell counting kit-8; NPMSCs: Nucleus pulposus-derived mesenchymal stem cells; UA: Urolithin A.
- Citation: Shi PZ, Wang JW, Wang PC, Han B, Lu XH, Ren YX, Feng XM, Cheng XF, Zhang L. Urolithin a alleviates oxidative stress-induced senescence in nucleus pulposus-derived mesenchymal stem cells through SIRT1/PGC-1α pathway. World J Stem Cells 2021; 13(12): 1928-1946
- URL: https://www.wjgnet.com/1948-0210/full/v13/i12/1928.htm
- DOI: https://dx.doi.org/10.4252/wjsc.v13.i12.1928


