Copyright
©The Author(s) 2021.
World J Stem Cells. Nov 26, 2021; 13(11): 1762-1782
Published online Nov 26, 2021. doi: 10.4252/wjsc.v13.i11.1762
Published online Nov 26, 2021. doi: 10.4252/wjsc.v13.i11.1762
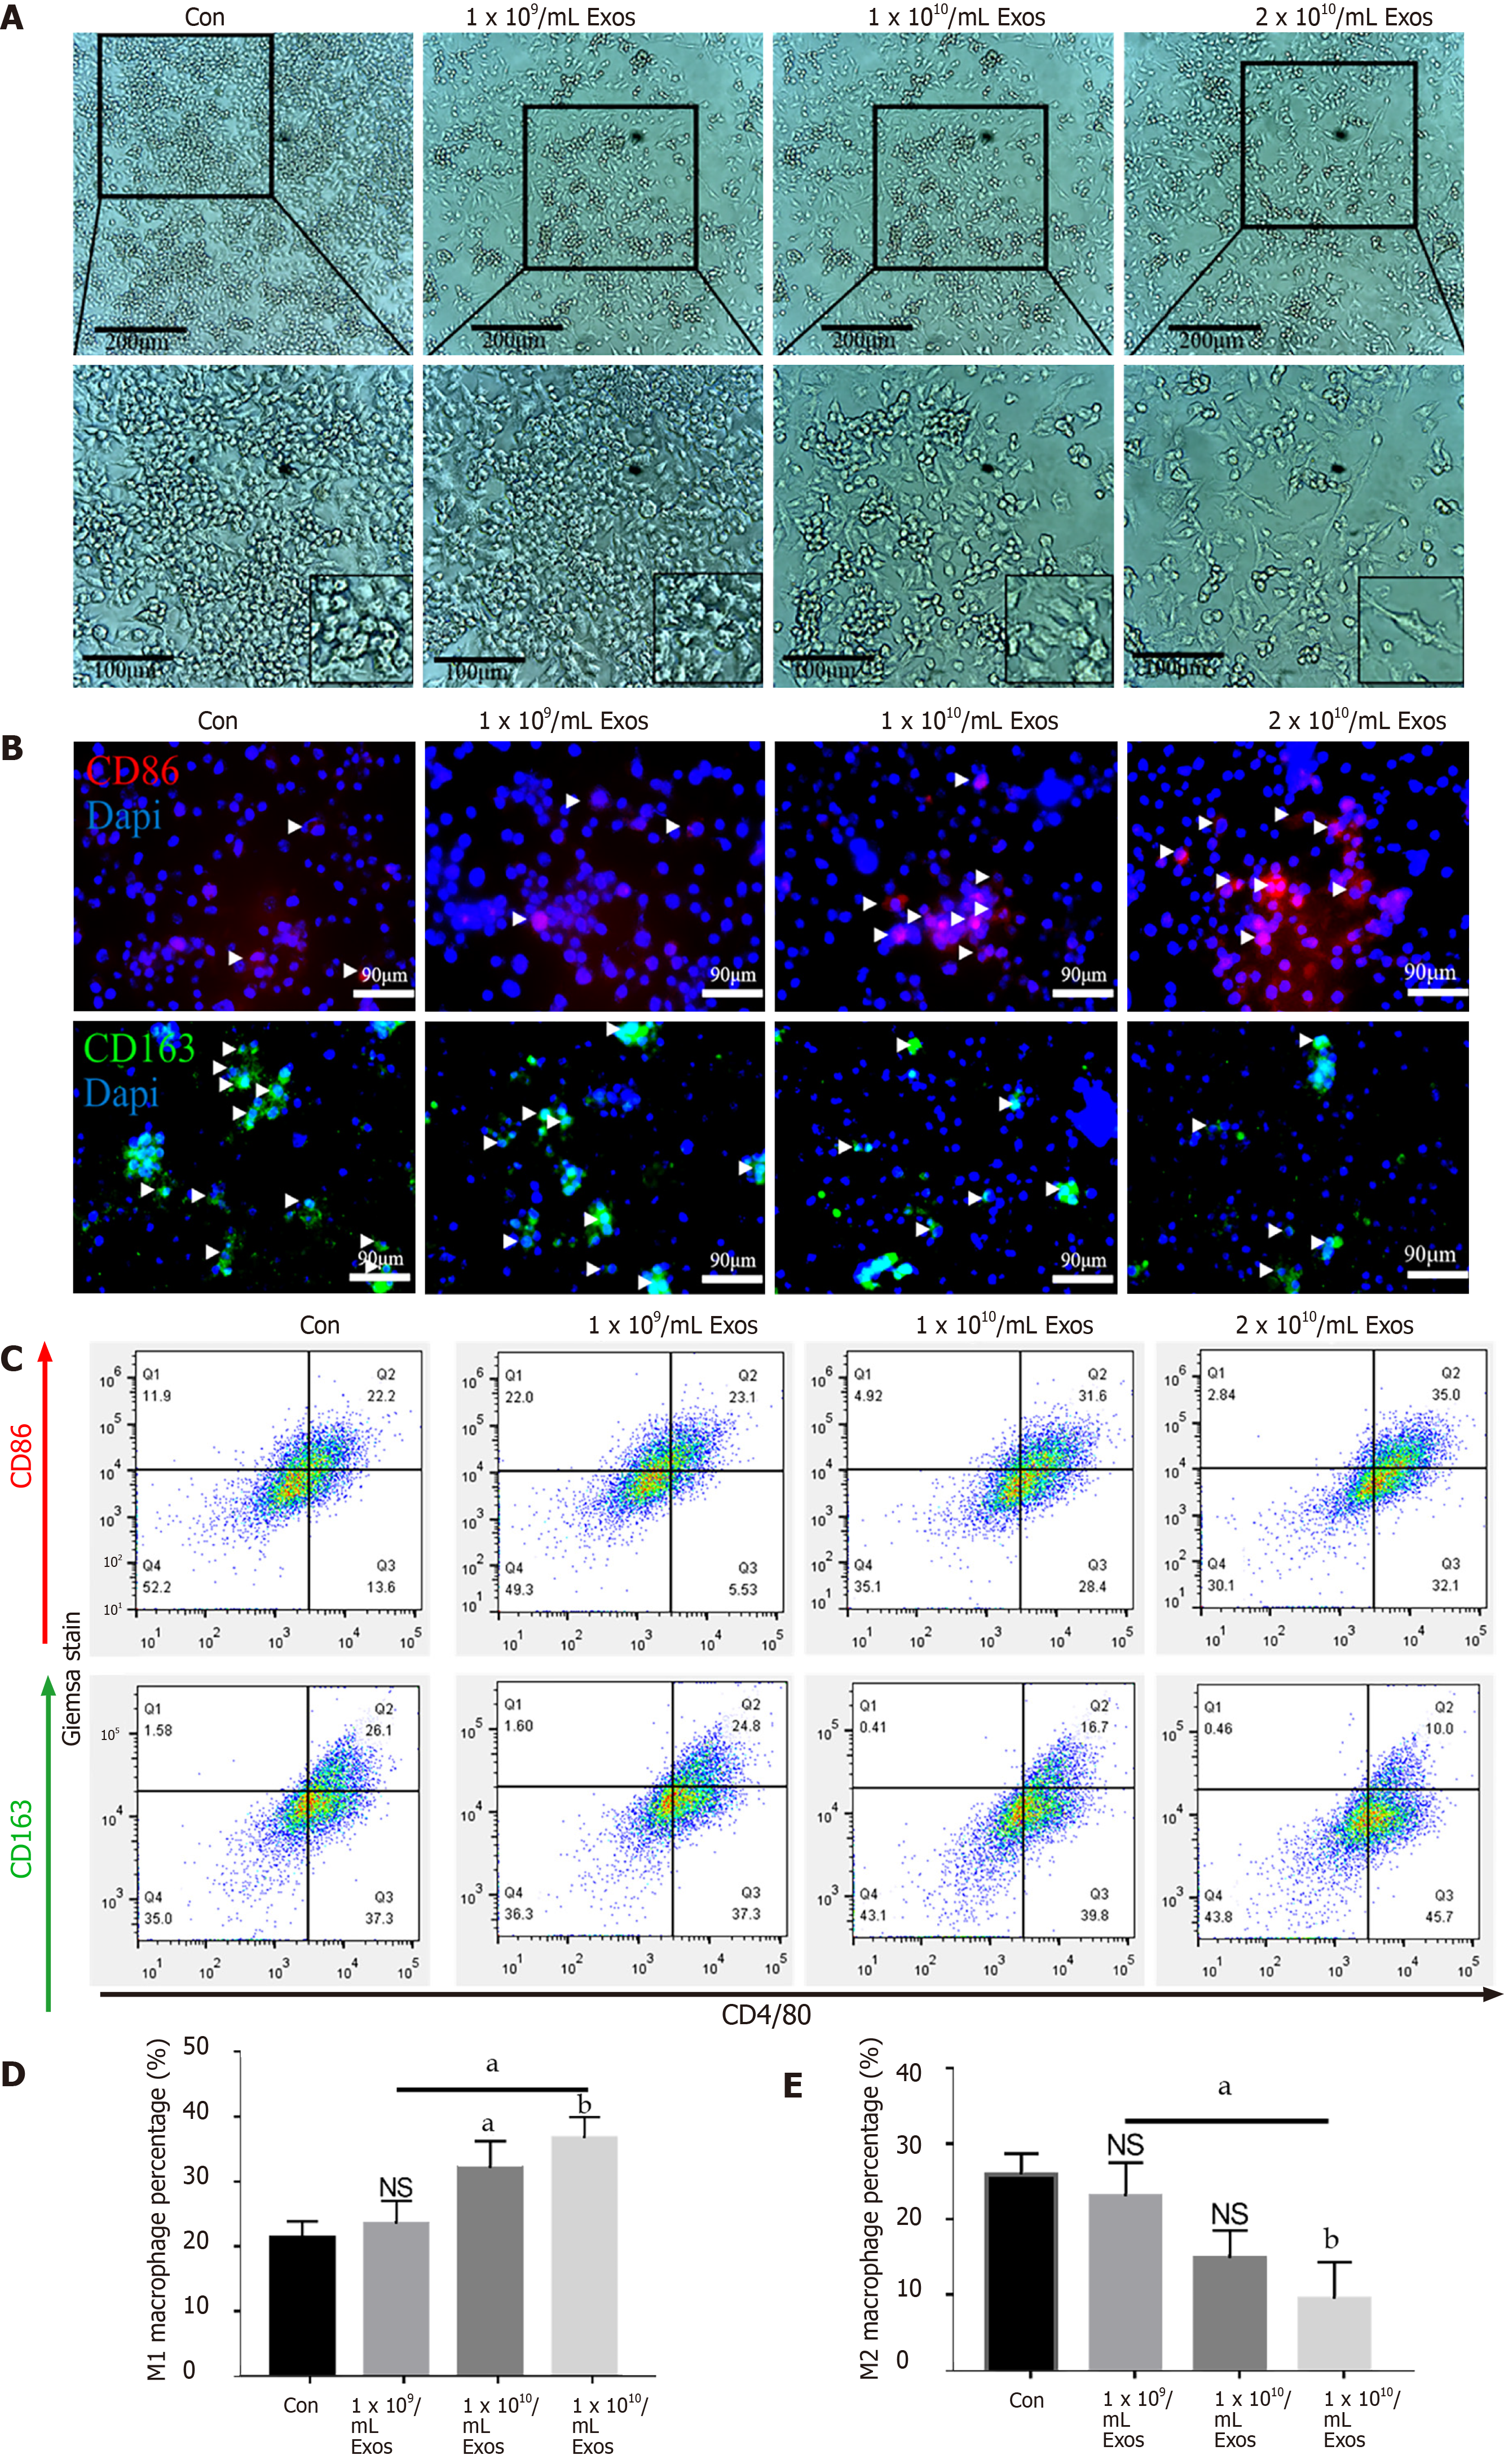
Figure 4 IF-C2C12-Exos induced M1 macrophage polarization in vitro.
A: Images of macrophages cultured with different concentrations of C2C12-Exos for 2 d (1 × 10⁹, 1 × 10¹⁰, 2 × 10¹⁰/medium). Scale bar = 200 μm or 100 μm; B: Immunofluorescence localization of CD86 (red), marker of M1 and CD206 (green), marker of M2 after culture with different concentrations of C2C12-Exos for 2 d. Scale bar = 90 μm. Arrows indicate CD206 or CD86 positive cells; C: Representative flow cytometry plots showing the percentages of M1 (CD86 + CD4/80+) and M2 (CD163 + CD4/80+) phenotype in macrophages after culture with different concentrations of C2C12-Exos for 24 h; D: Quantification of flow cytometry data (n = 3); E: M2 macrophages percentage. Data are presented as mean ± SD. aP < 0.05; bP < 0.01. NS: Not significant.
- Citation: Luo ZW, Sun YY, Lin JR, Qi BJ, Chen JW. Exosomes derived from inflammatory myoblasts promote M1 polarization and break the balance of myoblast proliferation/differentiation. World J Stem Cells 2021; 13(11): 1762-1782
- URL: https://www.wjgnet.com/1948-0210/full/v13/i11/1762.htm
- DOI: https://dx.doi.org/10.4252/wjsc.v13.i11.1762


