Copyright
©The Author(s) 2020.
World J Stem Cells. Oct 26, 2020; 12(10): 1184-1195
Published online Oct 26, 2020. doi: 10.4252/wjsc.v12.i10.1184
Published online Oct 26, 2020. doi: 10.4252/wjsc.v12.i10.1184
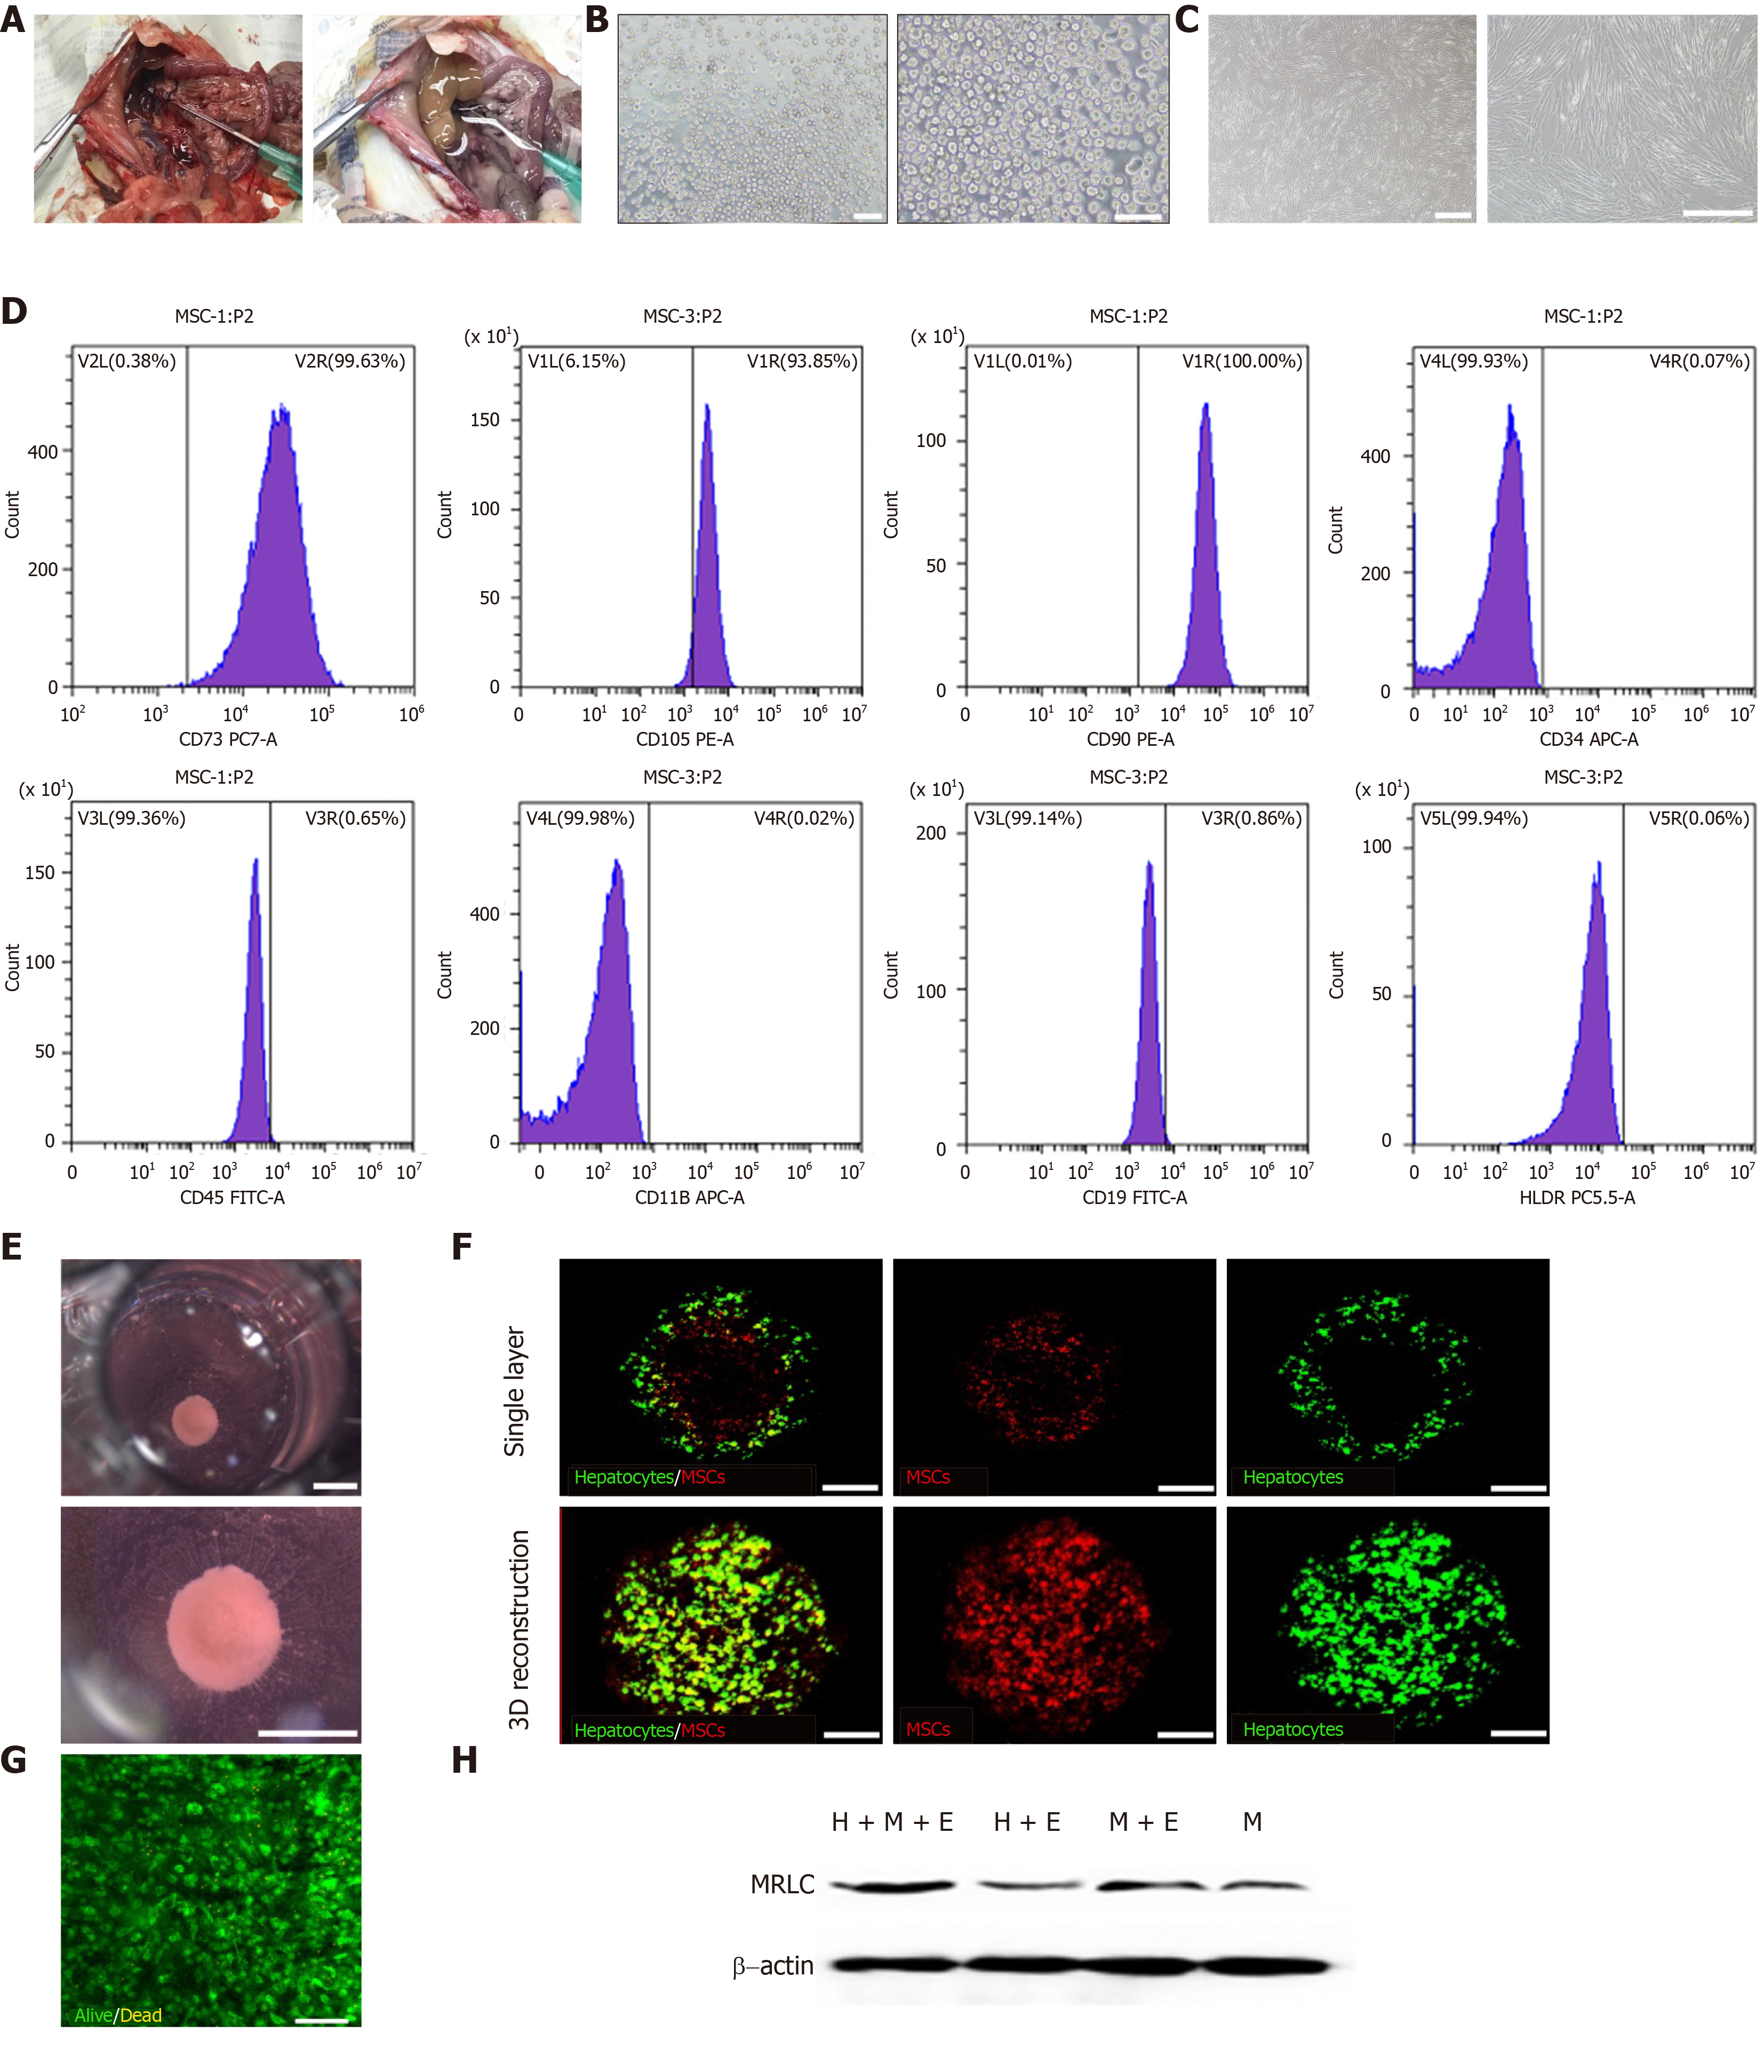
Figure 2 Self-assembly of liver organoids via mesenchymal stem cell-driven condensation.
A: Gross view of rat liver before (left) and after (right) perfusion via hepatic portal vein; B: Image of freshly isolated primary hepatocytes. Scale bars = 100 μm; C: Images of mesenchymal stem cells (MSCs). Scale bars = 500 μm; D: Expression of cell surface markers on MSCs. MSCs were positive for the mesenchymal markers CD73, CD105, and CD90, and negative or with low expression for hematopoietic markers CD34, CD45, CD19, and CD11b, and no expression of HLA-DR; E: Gross view of organoid. Scale bars = 1000 μm; F: Confocal images of the organoids. Green: Hepatocytes; red: MSCs. Top: A single layer; bottom: 3D reconstruction. scale bars = 200 μm; G: Staining for cell viability with Fluoroquench. Scale bar = 100 μm; H: Western blot analysis of myosin-II regulatory light chain. 3D: Three dimension; MRLC: Myosin-II regulatory light chain; H+M+E group: Hepatocytes and MSCs seeded on ECM-gel pre-coated plate; H+E group: Hepatocytes seeded on ECM-gel pre-coated plate; M+E group: MSCs seeded on ECM-gel pre-coated plate; M group: MSCs seeded on ECM-gel free plate; ECM: Extracellular matrix.
- Citation: He YT, Zhu XL, Li SF, Zhang BQ, Li Y, Wu Q, Zhang YL, Zhou YY, Li L, Qi YN, Bao J, Bu H. Creating rat hepatocyte organoid as an in vitro model for drug testing. World J Stem Cells 2020; 12(10): 1184-1195
- URL: https://www.wjgnet.com/1948-0210/full/v12/i10/1184.htm
- DOI: https://dx.doi.org/10.4252/wjsc.v12.i10.1184


