Copyright
©The Author(s) 2019.
World J Stem Cells. Mar 26, 2019; 11(3): 180-195
Published online Mar 26, 2019. doi: 10.4252/wjsc.v11.i3.180
Published online Mar 26, 2019. doi: 10.4252/wjsc.v11.i3.180
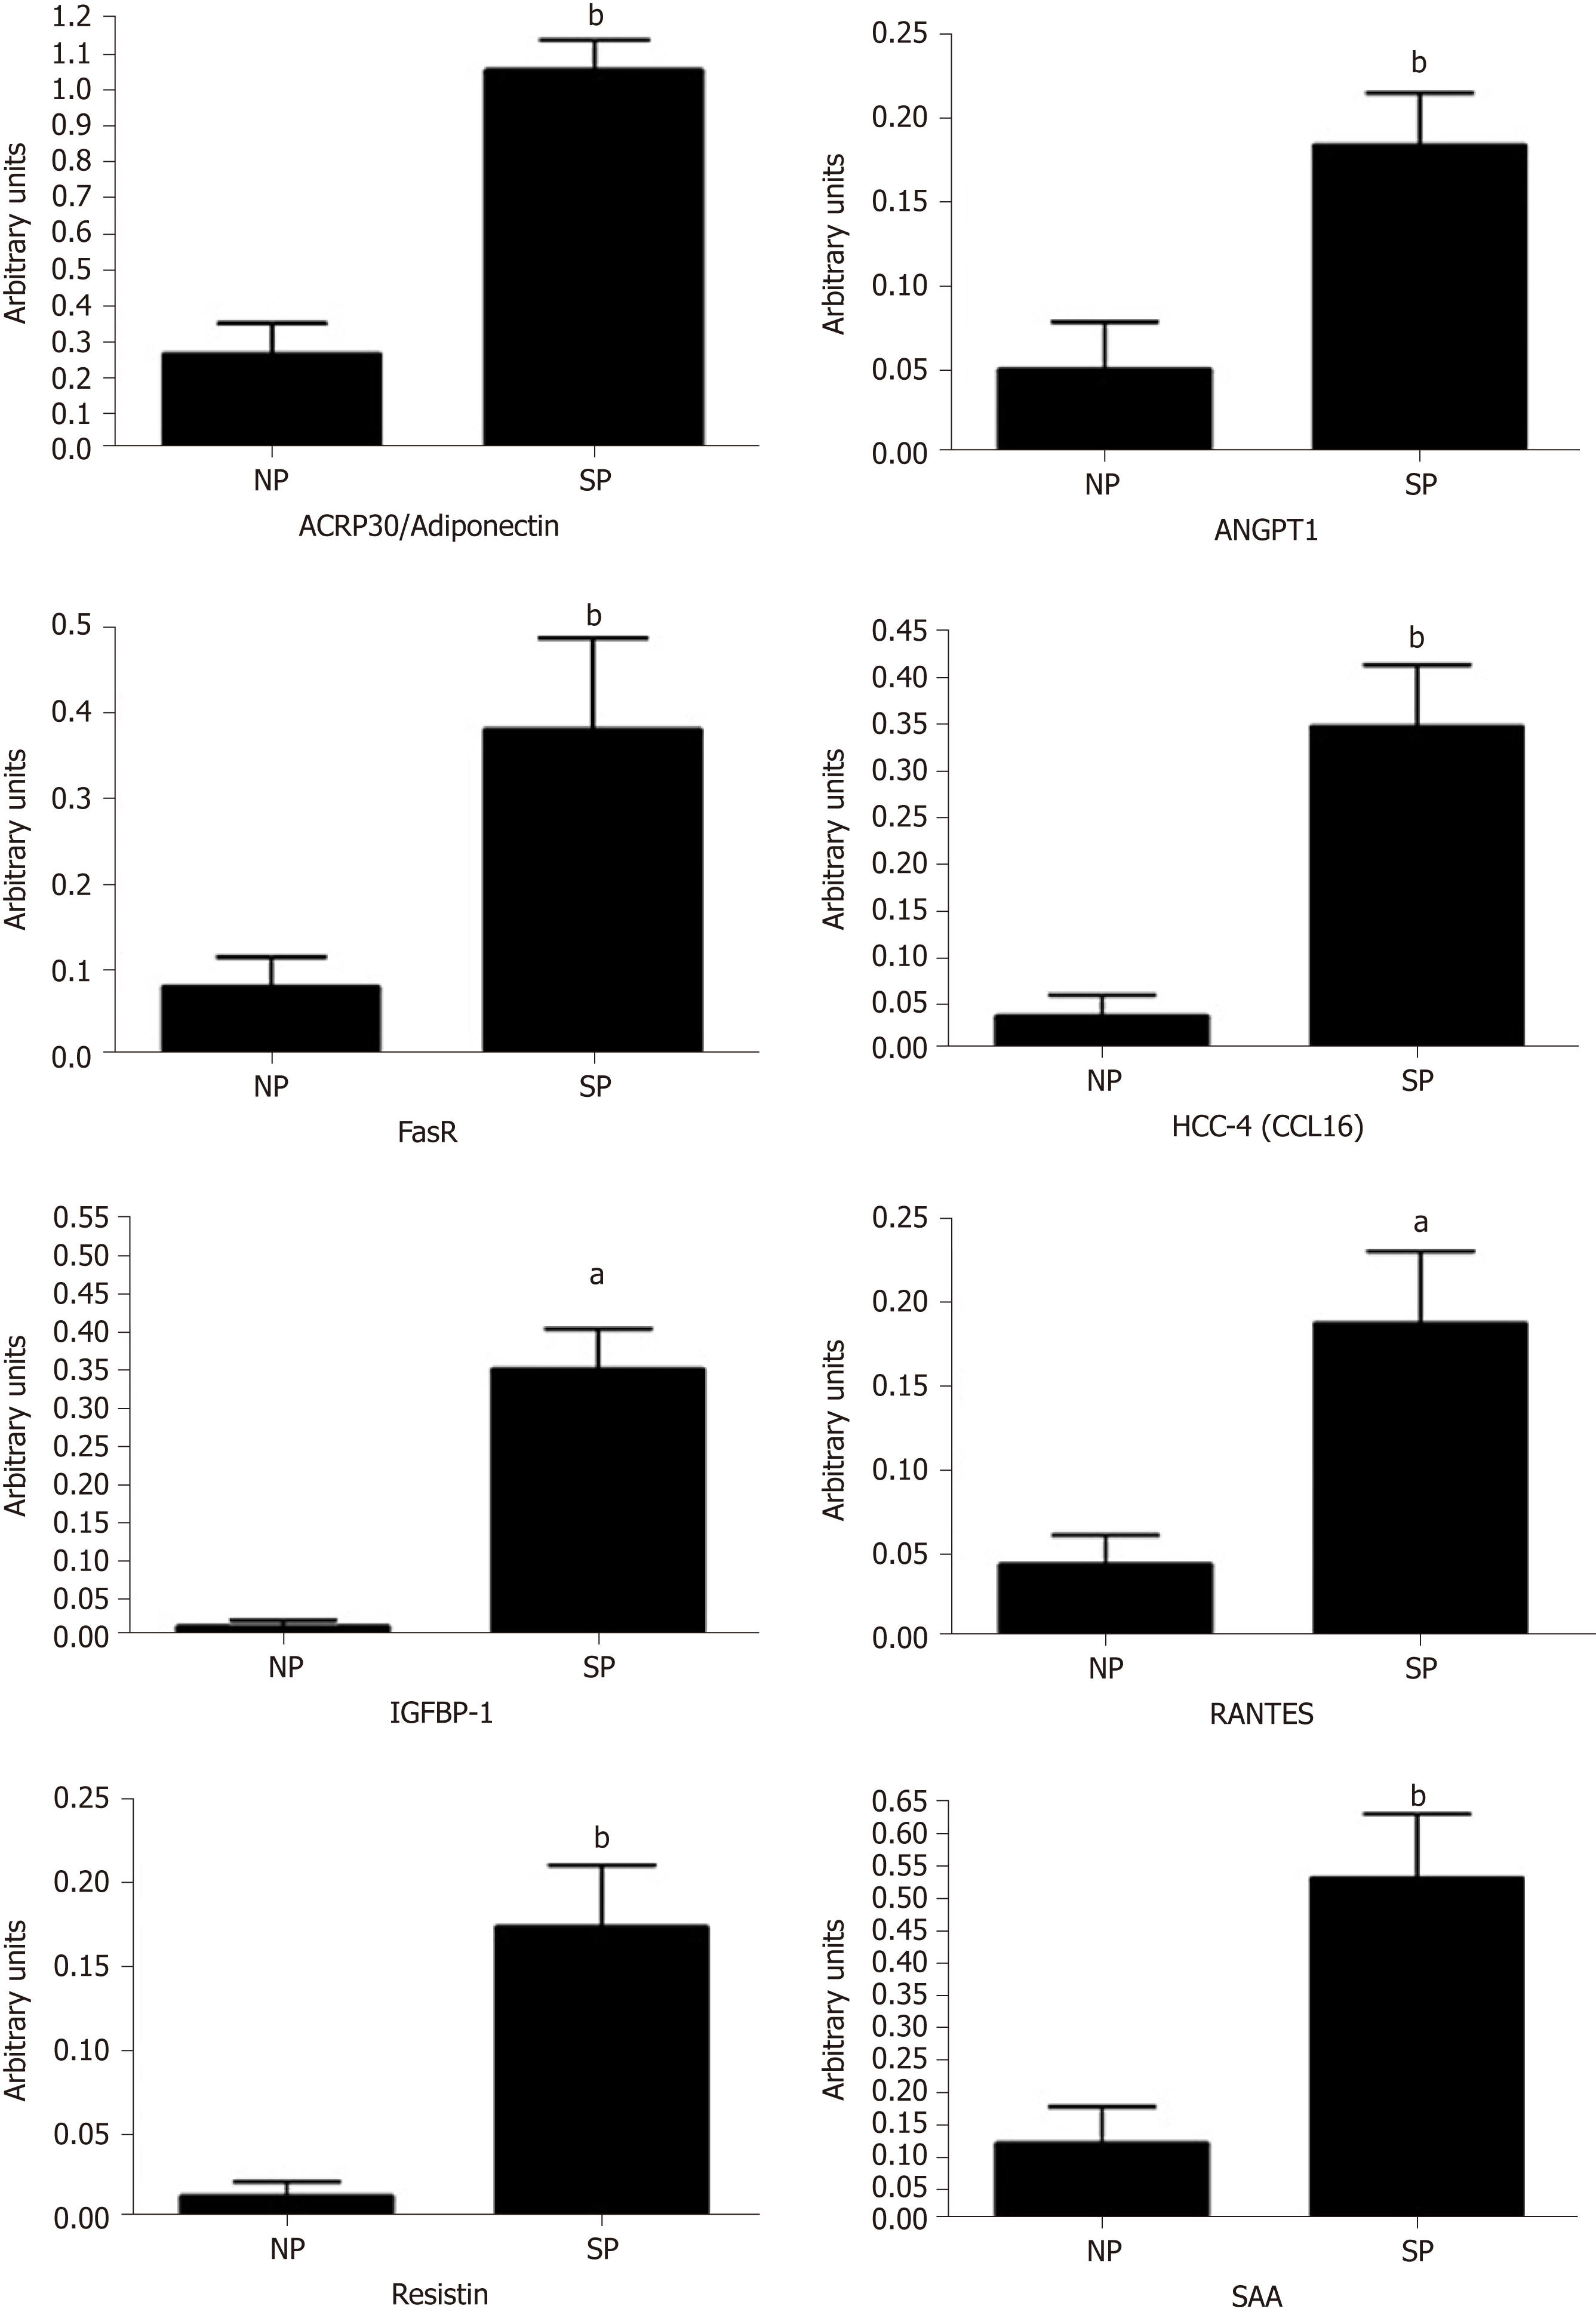
Figure 6 Cytokines detection in sera.
The histogram shows the cytokines on the Human Obesity Antibody Array C1 (RayBiotech, Norcross, GA United States) that were detected in SP and NP sera. Array signals were acquired using the Chemidoc system (Bio-Rad) and the associated software QuantityOne. Data are expressed as arbitrary units (n = 3 ± SD, aP < 0.05, bP < 0.01). The picture shows only the cytokines whose expression was above the limit of quantification. NP: Normal people; SP: Skinny people; SAA: Serum amyloid A; RANTES: CCL5; IGFBP-1: Insulin-like growth-factor-binding protein-1.
- Citation: Alessio N, Squillaro T, Monda V, Peluso G, Monda M, Melone MA, Galderisi U, Di Bernardo G. Circulating factors present in the sera of naturally skinny people may influence cell commitment and adipocyte differentiation of mesenchymal stromal cells. World J Stem Cells 2019; 11(3): 180-195
- URL: https://www.wjgnet.com/1948-0210/full/v11/i3/180.htm
- DOI: https://dx.doi.org/10.4252/wjsc.v11.i3.180


