Copyright
©The Author(s) 2019.
World J Stem Cells. Mar 26, 2019; 11(3): 180-195
Published online Mar 26, 2019. doi: 10.4252/wjsc.v11.i3.180
Published online Mar 26, 2019. doi: 10.4252/wjsc.v11.i3.180
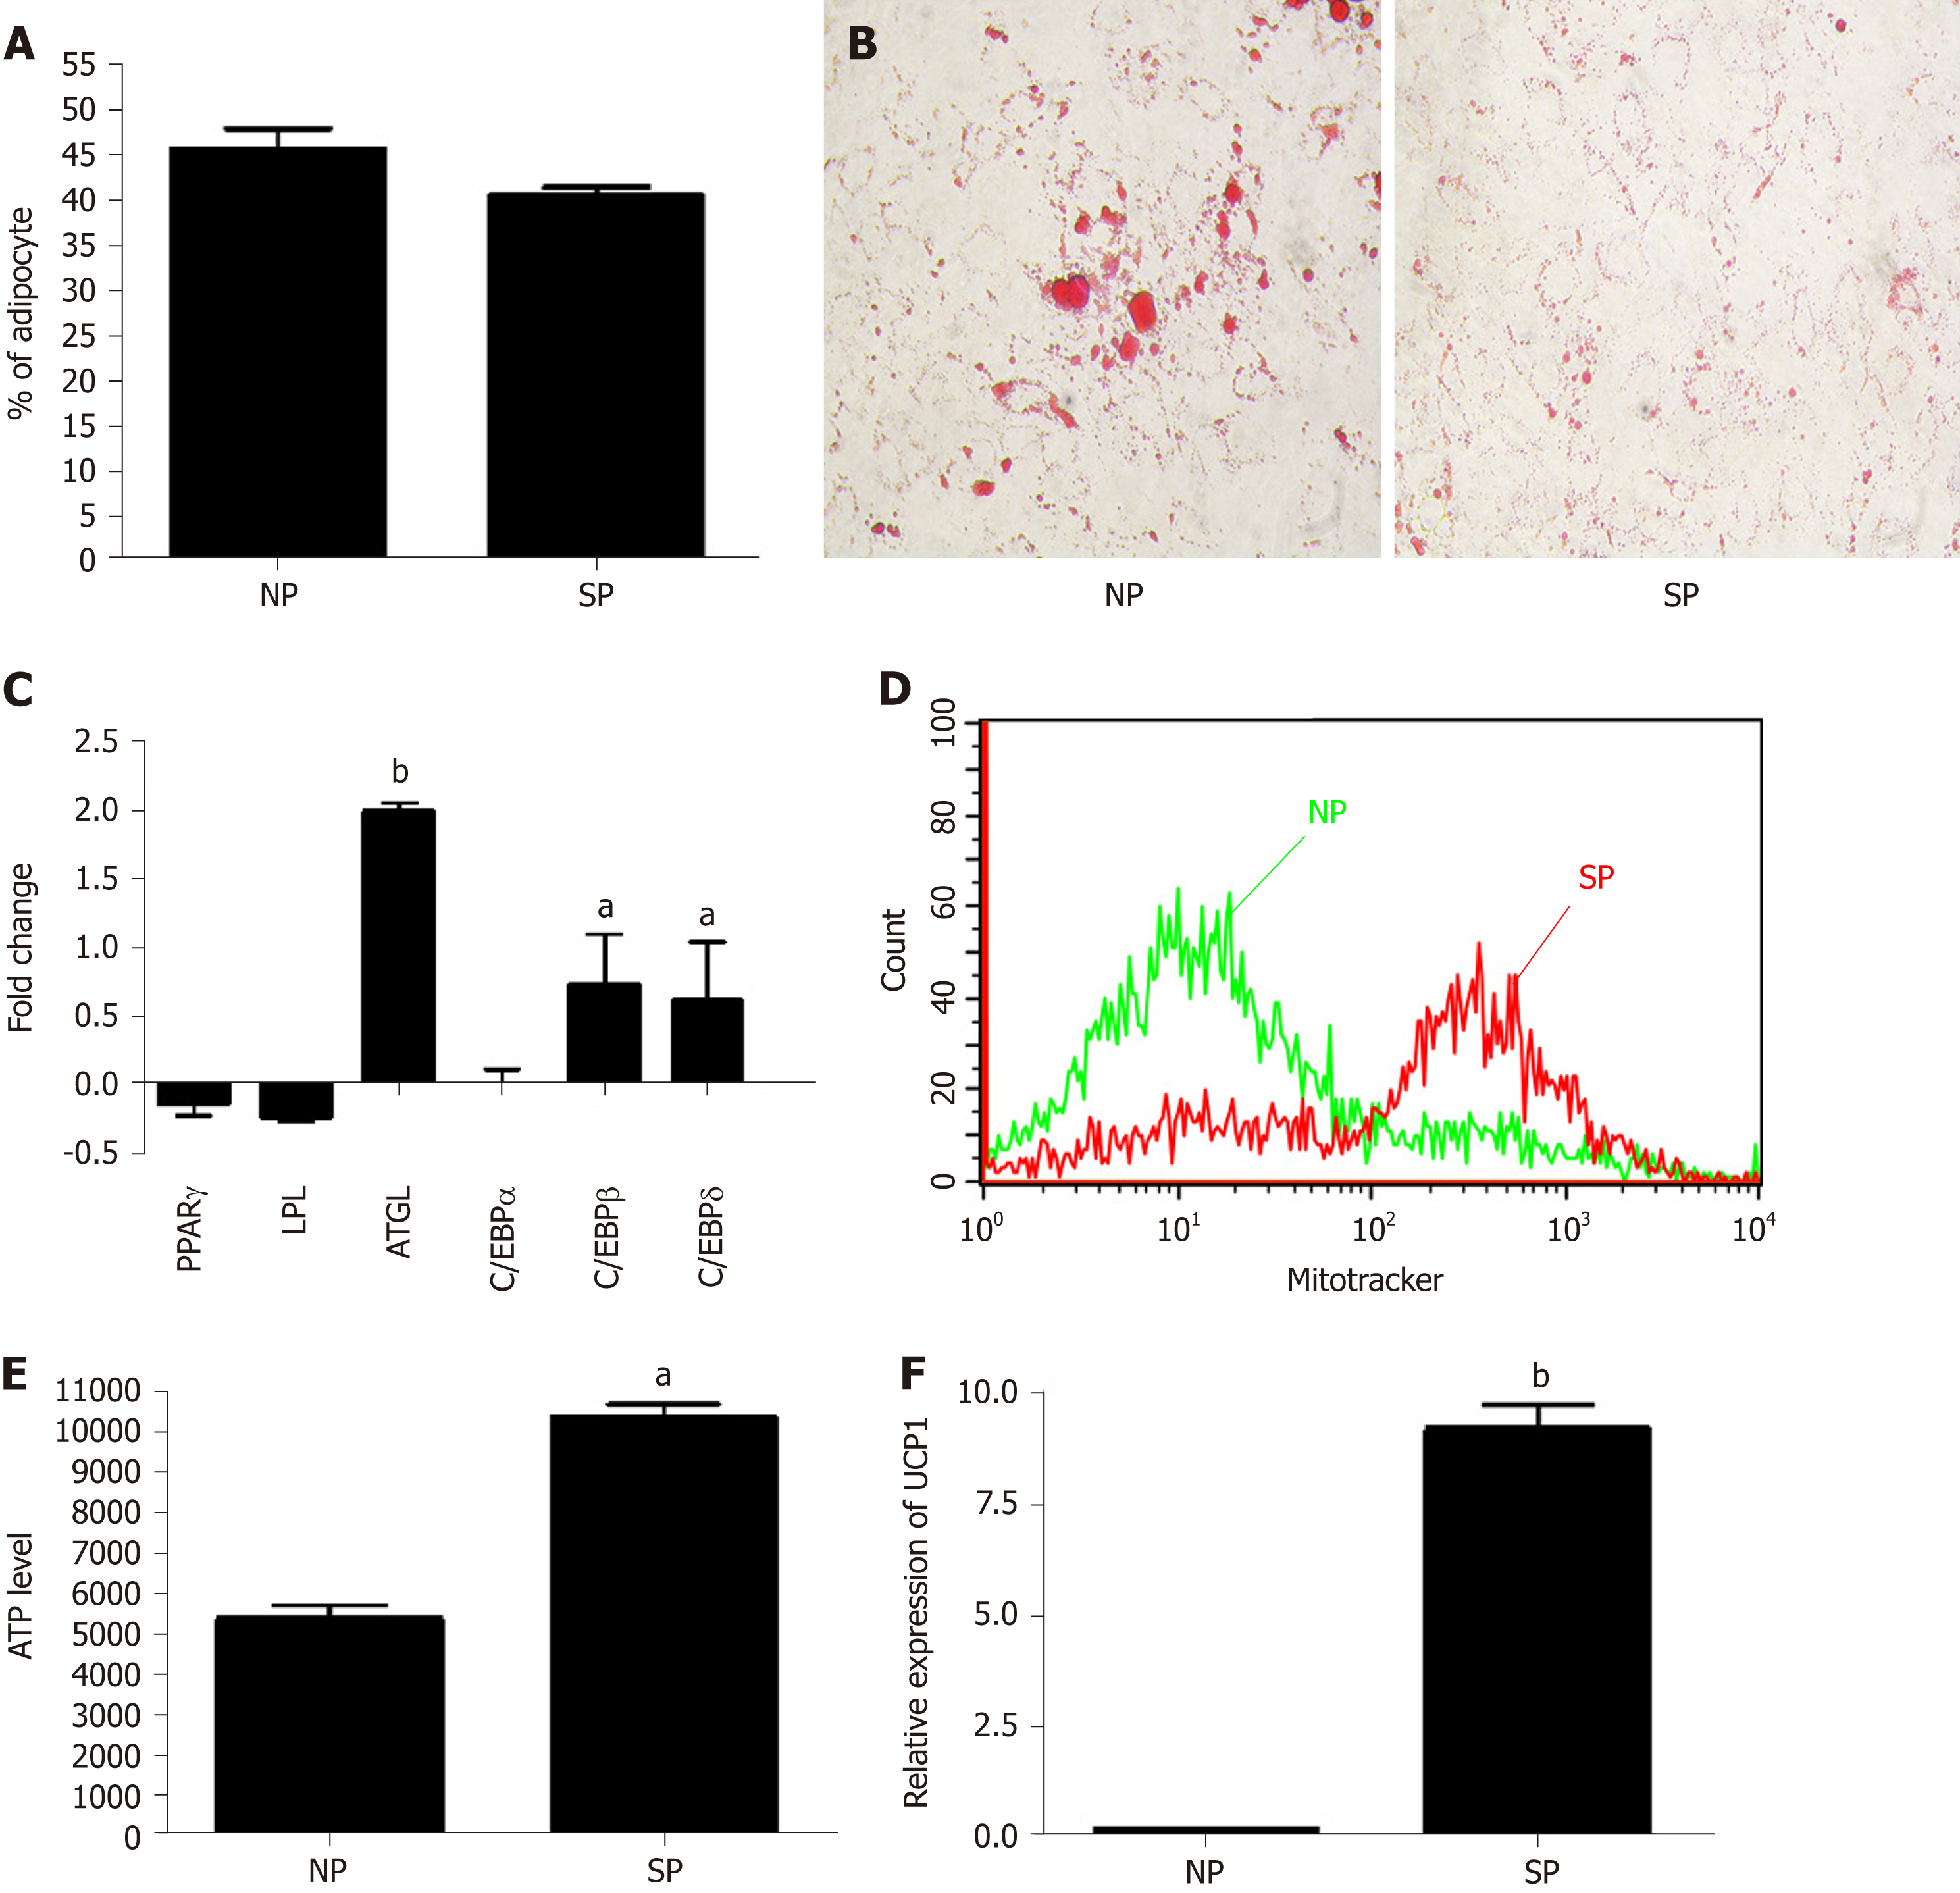
Figure 5 Analysis of mesenchymal stromal cell induced adipocyte differentiation after initial priming of 7 d with skinny people sera and subsequently treated with adipogenic differentation medium.
A: Percentage of adipocytes, as detected by Oil Red O staining; B: Evaluation of lipid droplets size by Oil Red O staining in mesenchymal stromal cells (MSCs); C: mRNA expression levels of early and late adipocyte differentiation markers. Early genes (C/EBPß and C/EBPδ) are used to identify committed adipocyte progenitors, while late genes (PPARγ, C/EBPα, LPL, and ATGL) are expressed in terminally differentiated adipocytes. The mRNA levels were normalized with respect to GAPDH, which was chosen as an internal control. Each experiment was repeated at least three times. Data are expressed as fold change in skinny people (SP) vs normal people (NP) (bP < 0.01); D: MitoTracker probes to label the mitochondria in MSC cultures. Data were acquired by Guava EasyCyte flow cytometer. The graph shows the mitochondria staining per cell. The medium stain intensity (X axis) is lower in NP-primed samples compared with SP samples; E: ATP level measured by ATP Colorimetric/Fluorometric Assay Kit in MSCs treated with NP and SP sera and then incubated in minimal medium without energetic supplements (amino acids, carbohydrates, lipids). Data are expressed as arbitrary units (n = 3 ± SD, aP < 0.05); F: mRNA expression levels of UCP1 in SP- and NP-primed cultures. The mRNA levels were normalized with respect to GAPDH and data are expressed as arbitrary units (n = 3 ± SD, bP < 0.01). NP: Normal people; SP: Skinny people; ATGL: Adipose triglyceride lipase.
- Citation: Alessio N, Squillaro T, Monda V, Peluso G, Monda M, Melone MA, Galderisi U, Di Bernardo G. Circulating factors present in the sera of naturally skinny people may influence cell commitment and adipocyte differentiation of mesenchymal stromal cells. World J Stem Cells 2019; 11(3): 180-195
- URL: https://www.wjgnet.com/1948-0210/full/v11/i3/180.htm
- DOI: https://dx.doi.org/10.4252/wjsc.v11.i3.180


