Copyright
©The Author(s) 2019.
World J Stem Cells. Mar 26, 2019; 11(3): 180-195
Published online Mar 26, 2019. doi: 10.4252/wjsc.v11.i3.180
Published online Mar 26, 2019. doi: 10.4252/wjsc.v11.i3.180
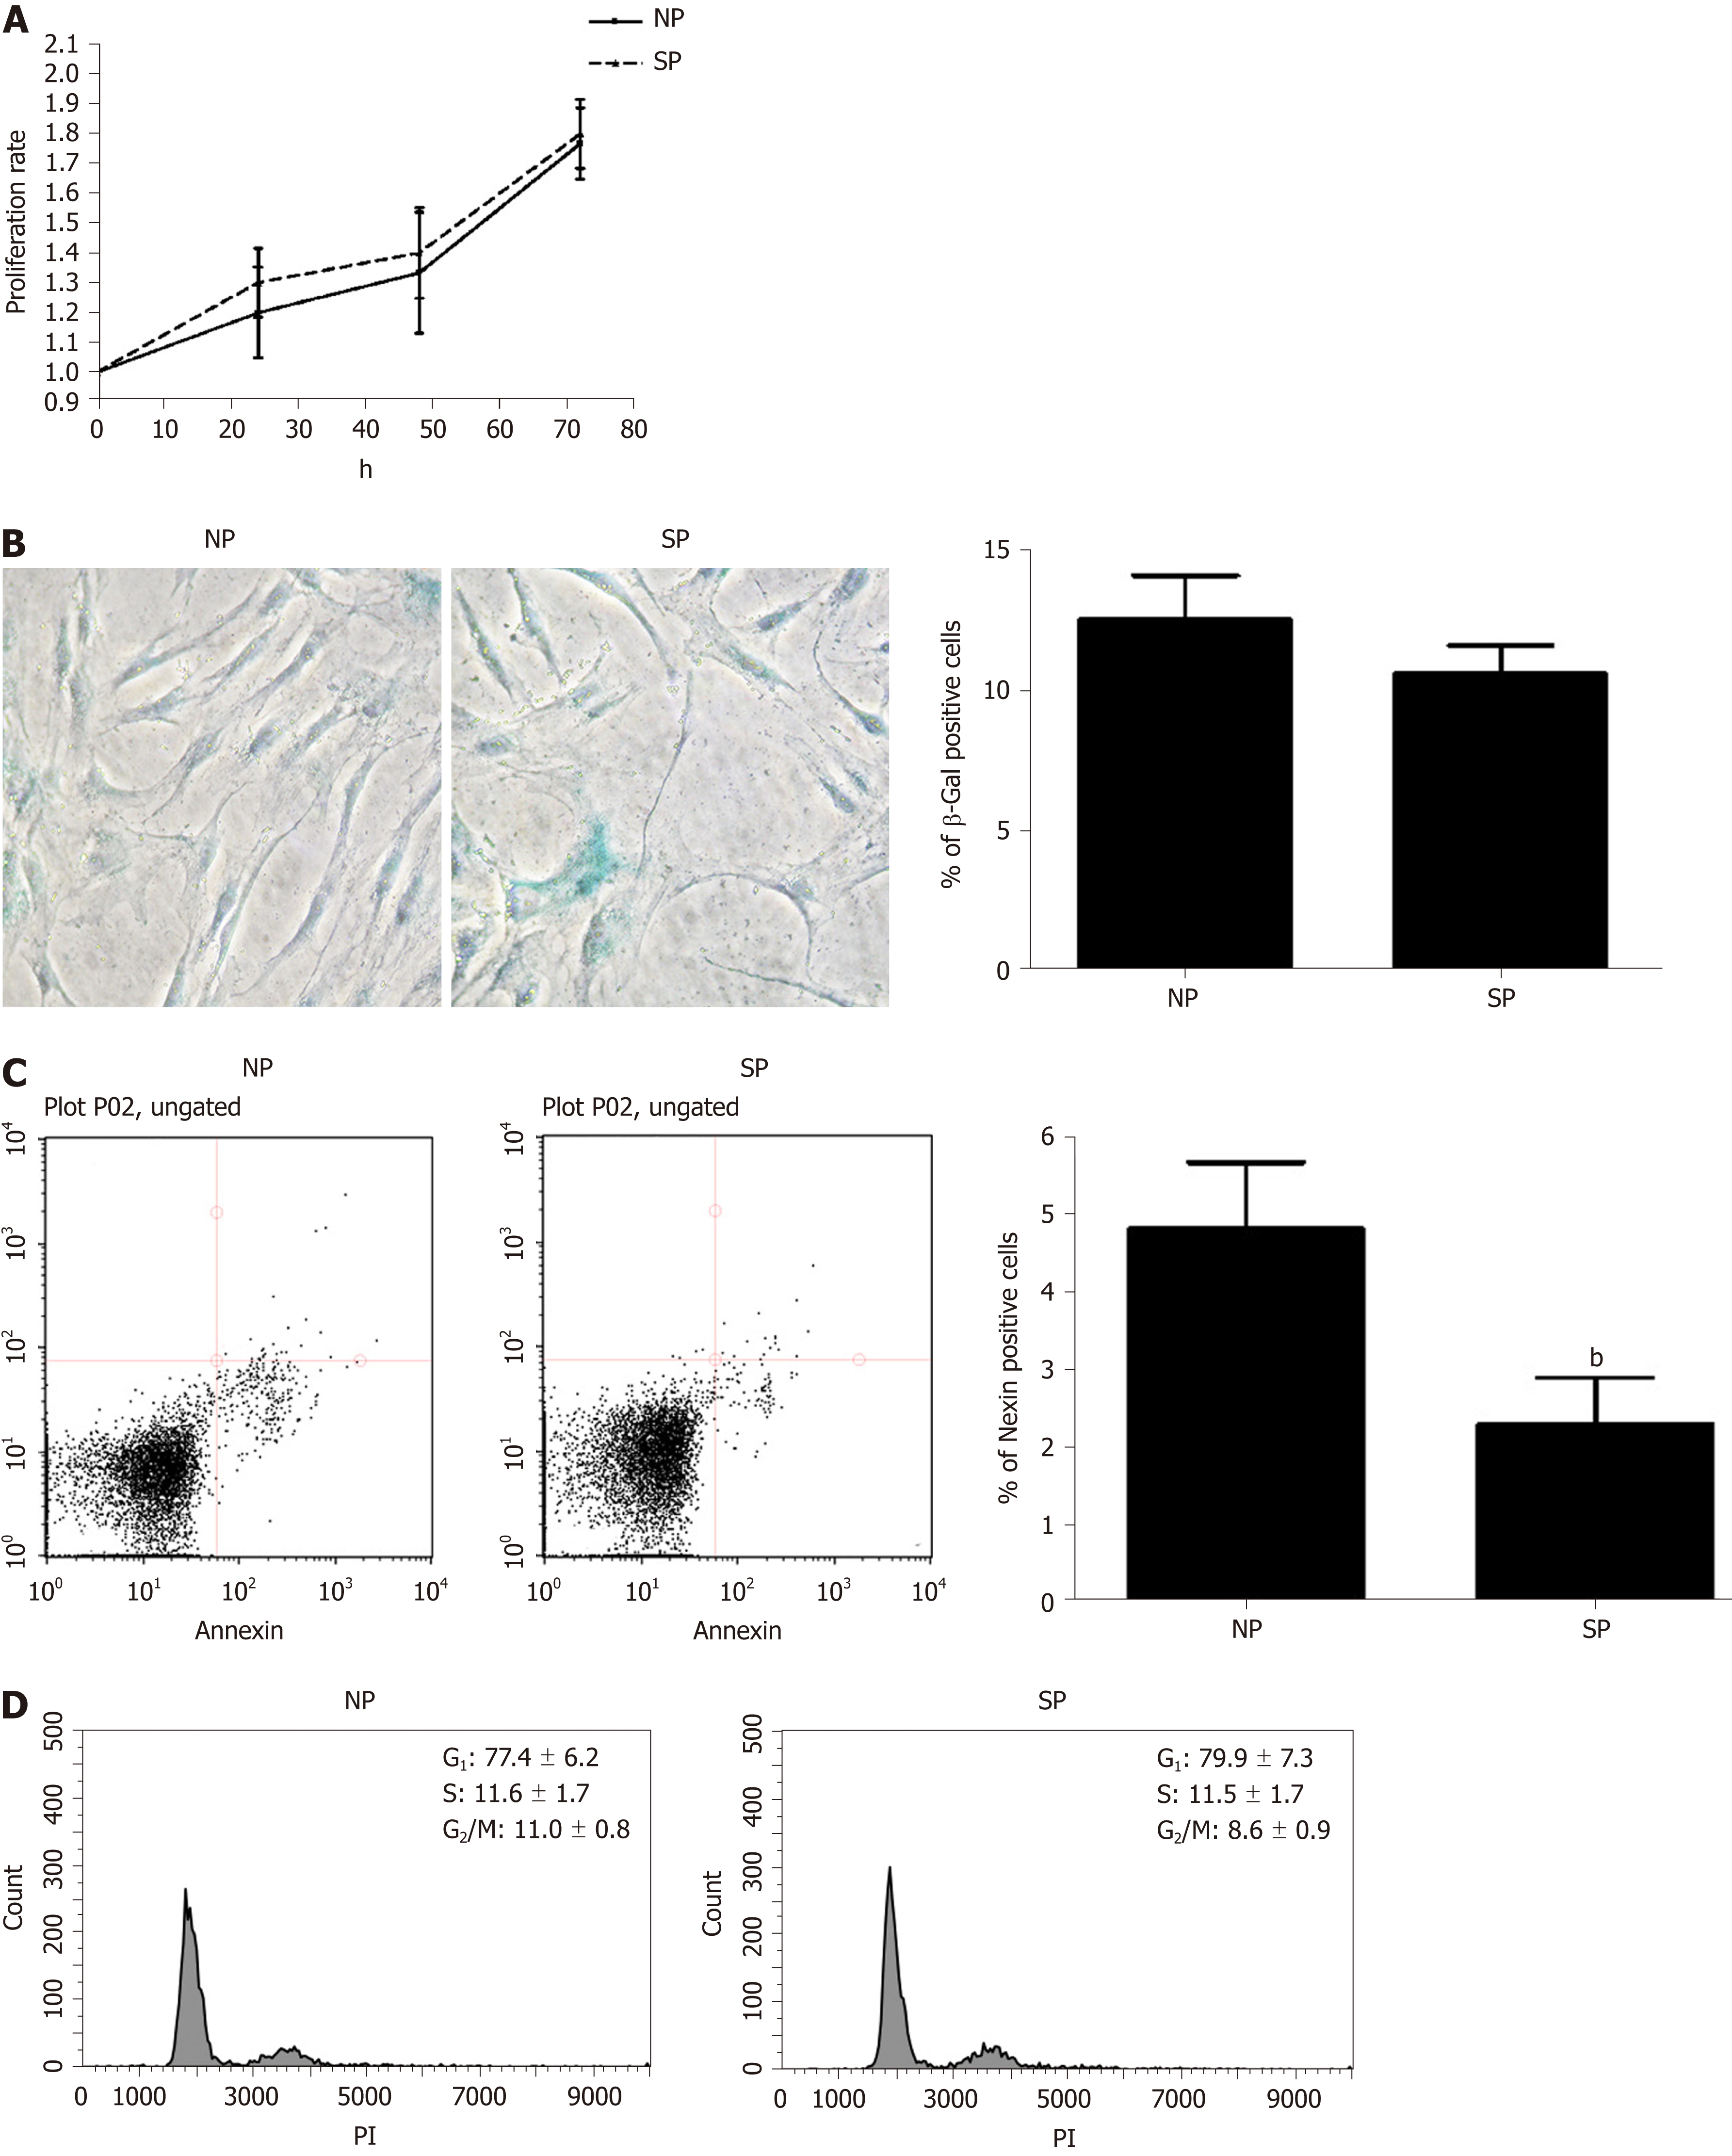
Figure 2 Mesenchymal stromal cell proliferation, cell cycle analysis, apoptosis, and senescence, following treatment with skinny people and normal people sera.
A: Cell proliferation of mesenchymal stromal cells (MSCs) was evaluated by a Quick Cell Proliferation Assay Kit II (Biovision, CA, United States) after treatment with normal people (NP) and skinny people (SP) serum; B: Senescence in MSC cultures. Representative microscopic fields of acid beta-galactosidase positive cells (blue) in NP- and SP-serum treated cultures. In the same panel, the graph shows mean percentage value of senescent cells (± SD, n = 3); C: Representative FACS analysis of MSC apoptosis. The experiments were carried out one week after treatment with sera. The assay allows the identification of early (Annexin V + and 7ADD −) and late apoptosis (Annexin V + and 7ADD +). Nevertheless, apoptosis is a continuous process and we calculated the percentage of apoptosis as the sum of early and late apoptotic cells, to avoid a discretional separation between early and late apoptosis. The histogram show the global percentage of Annexin V-positive cells. Data are expressed with standard deviation (n = 3, bP < 0.01); D: Representative Cell cycle FACS analysis of MSCs treted with NP and SP serum. Data are expressed with SD (n = 3). MSCs: Mesenchymal stromal cells; NP: Normal people; SP: Skinny people.
- Citation: Alessio N, Squillaro T, Monda V, Peluso G, Monda M, Melone MA, Galderisi U, Di Bernardo G. Circulating factors present in the sera of naturally skinny people may influence cell commitment and adipocyte differentiation of mesenchymal stromal cells. World J Stem Cells 2019; 11(3): 180-195
- URL: https://www.wjgnet.com/1948-0210/full/v11/i3/180.htm
- DOI: https://dx.doi.org/10.4252/wjsc.v11.i3.180


