Copyright
©2013 Baishideng Publishing Group Co.
World J Stem Cells. Oct 26, 2013; 5(4): 196-204
Published online Oct 26, 2013. doi: 10.4252/wjsc.v5.i4.196
Published online Oct 26, 2013. doi: 10.4252/wjsc.v5.i4.196
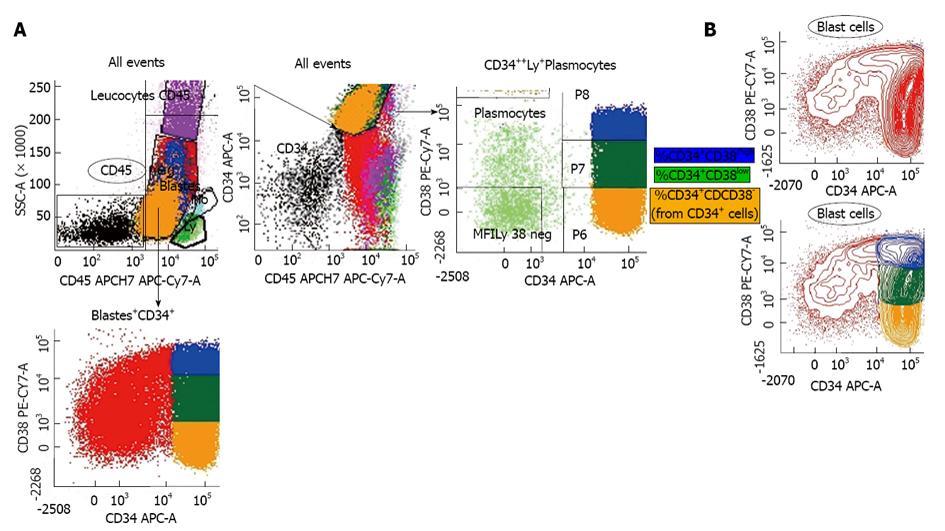
Figure 1 Multicolor flow cytometry (patient # 3): (left) Strategy used for gating the blast cell population and CD34+CD38 cell subpopulations (red: immature CD45low/SSC blast cells, blue: CD34+ cells, green: lymphocytes, blue cyan: monocytes, violet: granulocytes, black: CD45+ cells (erythroblasts); CD34+ cells were separated into different stem cell fractions based on their CD38 antigen expression: A first cell population expressing a great amount of the CD34 antigen and lacked of CD38 (CD34+CD38-), a second cell population characterized by a great amount of the CD34 antigen and by a low density of CD38 antigen (CD34+CD38low/), and a third cell population characterized by a large density of CD38 antigen and of CD34 antigen (CD34+CD38+); (right) The two density plots indicate CD45low/SSC blast cells (in red) and CD34+CD38 subpopulations (CD34+CD38- in orange, CD34+CD38low in green and CD34+CD38+ in blue).
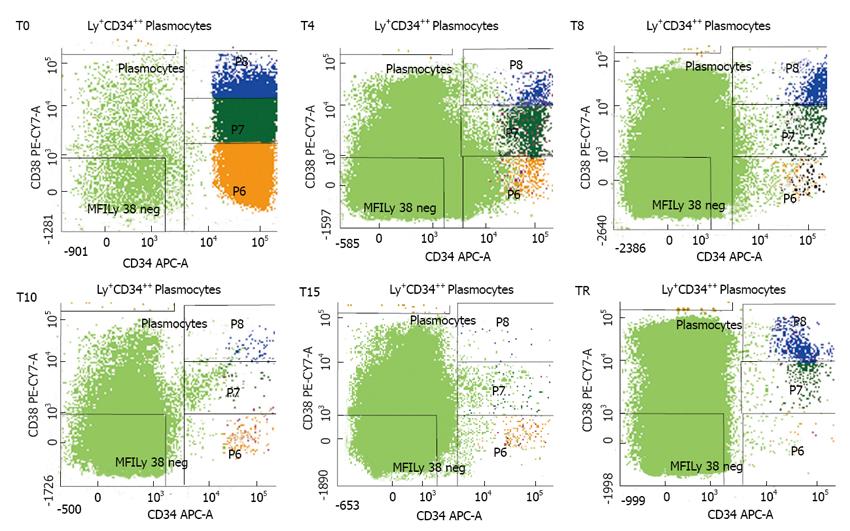
Figure 2 Characterization of the different stem cell fractions.
A typical example of analysis (patient 3) performed at different times: at diagnosis (T0), at the end of the first sequence of chemotherapy (4 d) (T4), at the beginning of the second sequence of chemotherapy (8 d) (T8), at the end of chemotherapy (10 d) (T10), during aplasia (15 d) (T15), and at the time of cell recovery (TR). CD34+ cells were separated into different stem cell fractions based on their CD38 antigen expression: A first cell population expressing a great amount of the CD34 antigen and lack of CD38 (CD34+CD38-); a second cell population characterized by a great amount of the CD34 antigen and by a low density of CD38 antigen (CD34+CD38low); and a third cell population characterized by a large density of CD38 antigen and of CD34 antigen (CD34+CD38+).
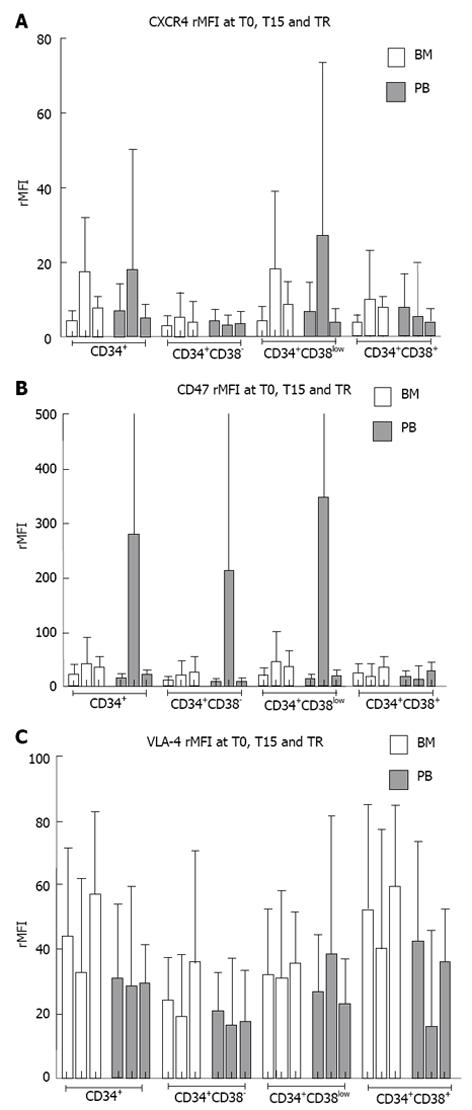
Figure 3 Evolution of CXCR4, CD47, and VLA-4 ratio median fluorescence intensity on CD34+ cells and CD34+CD38 cell sub-populations in bone marrow and peripheral blood.
A: CXCR4, B: CD47, C: VLA-4. PB: Peripheral blood; BM: Bone marrow; rMFI: Ratio median fluorescence intensity.
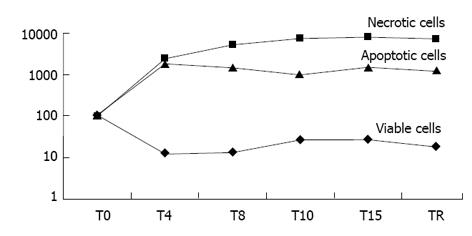
Figure 4 Kinetics of viable, apoptotic and necrotic cells in peripheral blood according to the different times of study (patient 8).
Values were given comparatively to those observed at the time of diagnosis, assuming that the observed value at T0 corresponded to 100%.
- Citation: Plesa A, Chelghoum Y, Mattei E, Labussière H, Elhamri M, Cannas G, Morisset S, Tagoug I, Michallet M, Dumontet C, Thomas X. Mobilization of CD34+CD38- hematopoietic stem cells after priming in acute myeloid leukemia. World J Stem Cells 2013; 5(4): 196-204
- URL: https://www.wjgnet.com/1948-0210/full/v5/i4/196.htm
- DOI: https://dx.doi.org/10.4252/wjsc.v5.i4.196


