Copyright
©The Author(s) 2023.
World J Stem Cells. Dec 26, 2023; 15(12): 1063-1076
Published online Dec 26, 2023. doi: 10.4252/wjsc.v15.i12.1063
Published online Dec 26, 2023. doi: 10.4252/wjsc.v15.i12.1063
Figure 1 Participant enrollment flow diagram.
ITT: Intention-to-treat; MFAT: Microfragmented adipose tissue.
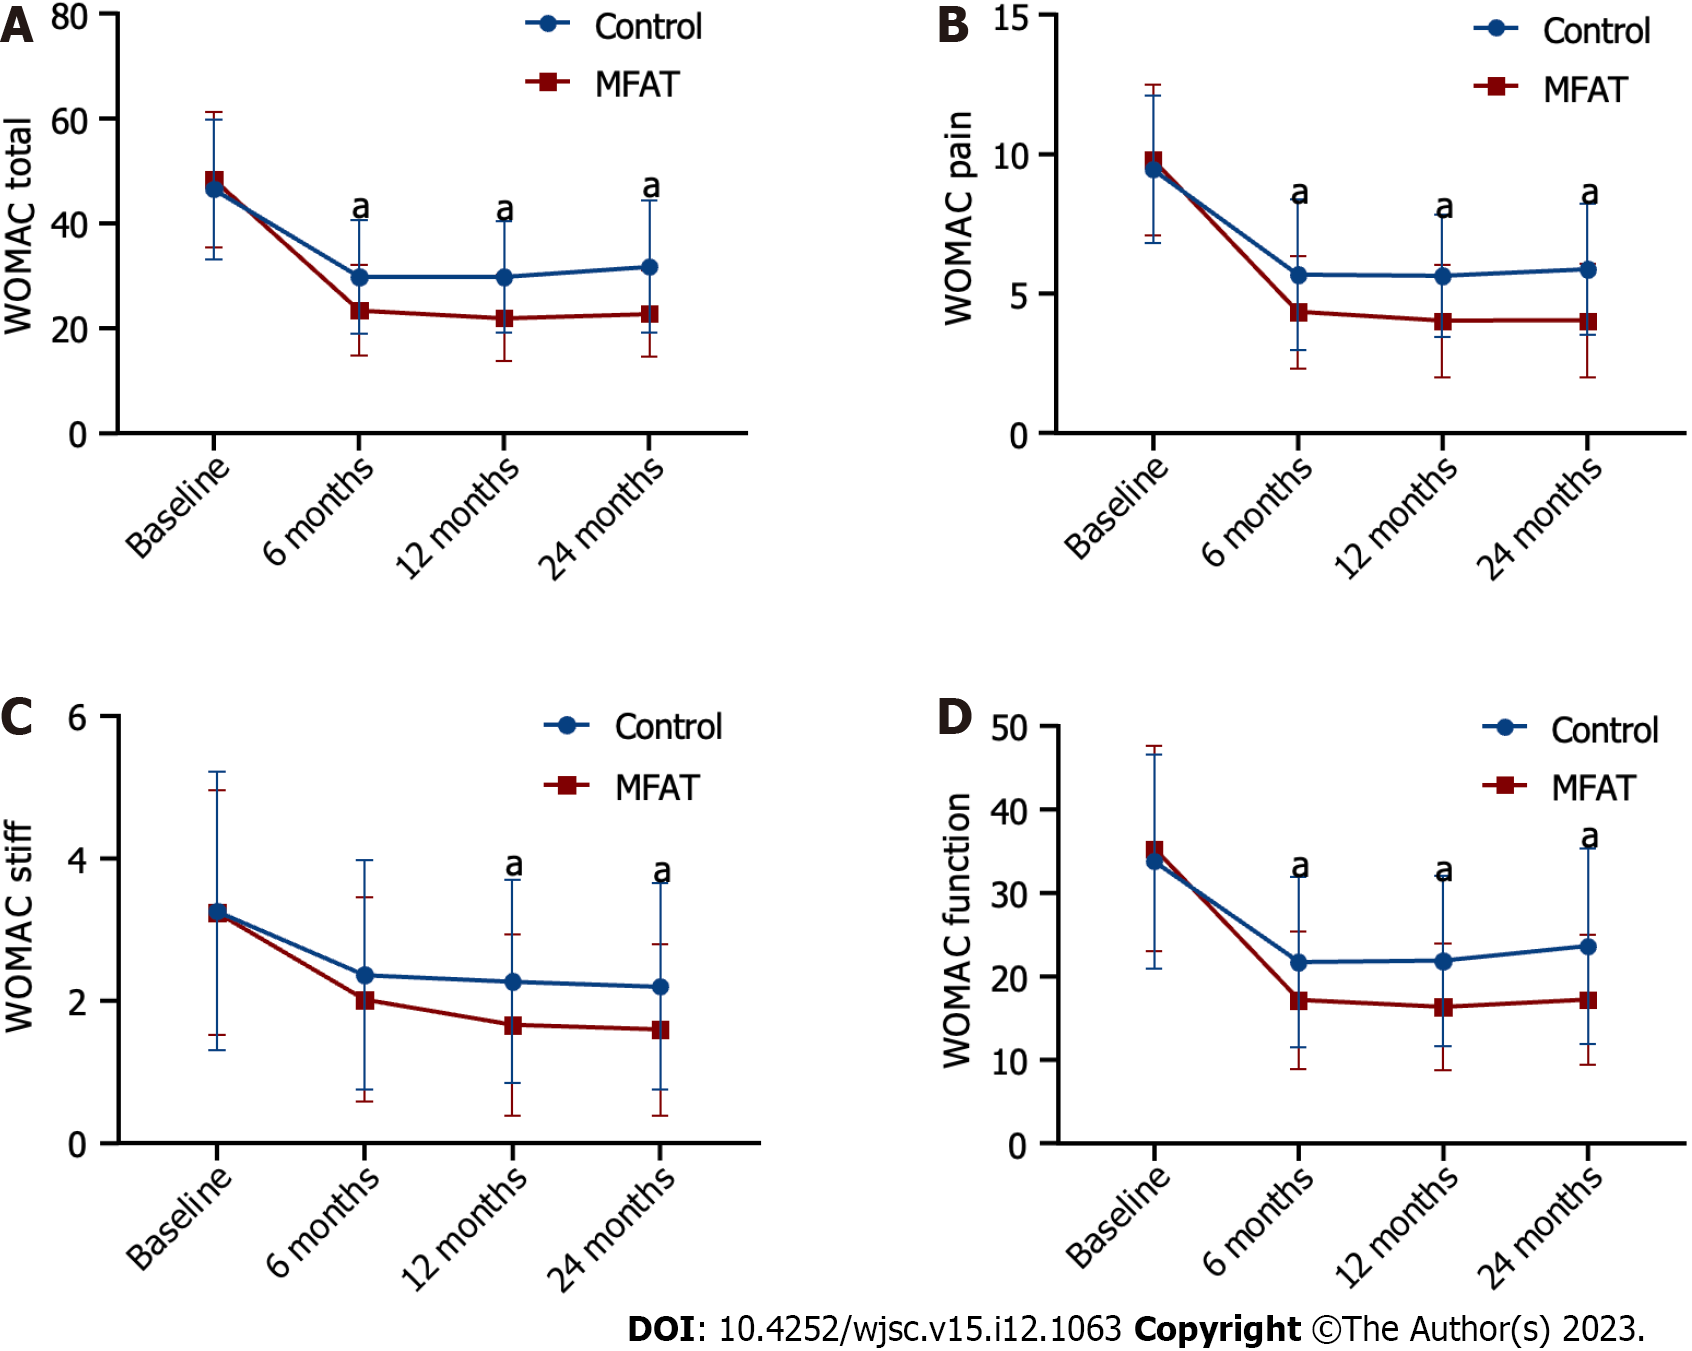
Figure 2 Trends of Western Ontario and McMaster Universities Osteoarthritis Index scores during the 24-mo follow-up for both groups.
A: Western Ontario and McMaster Universities Osteoarthritis Index (WOMAC) total score trends; B: WOMAC pain score trends; C: WOMAC stiffness score trends; D: WOMAC function score trends. Statistically significant differences have been reported as aP < 0.05 (microfragmented adipose tissue vs control). Results are presented as the means ± SD. WOMAC: Western Ontario and McMaster Universities Osteoarthritis Index; MFAT: Microfragmented adipose tissue.
Figure 3 Trends of the visual analog scale pain score, Lequesne index score, and Whole-Organ Magnetic Resonance Imaging Score during the 24-mo follow-up for both groups.
A: Visual analog scale pain score trends; B: Lequesne index score trends; C: Whole-Organ Magnetic Resonance Imaging Score change (n = 10 for each group). Statistically significant differences have been reported as aP < 0.05 (microfragmented adipose tissue vs control). Results are presented as the means ± SD. WORMS: Whole-Organ Magnetic Resonance Imaging Score; VAS: Visual analog scale; MFAT: Microfragmented adipose tissue.
Figure 4 Magnetic resonance imaging evaluation of osteochondral defect changes at 24 mo.
A: Sagittal images of the medial femur and tibia before injection of microfragmented adipose tissue (MFAT); B: Sagittal images of the medial femur and tibia 24 mo after MFAT injections. The osteochondral defect in the circled area was reduced, indicating articular cartilage regeneration at the site of the osteochondral defect.
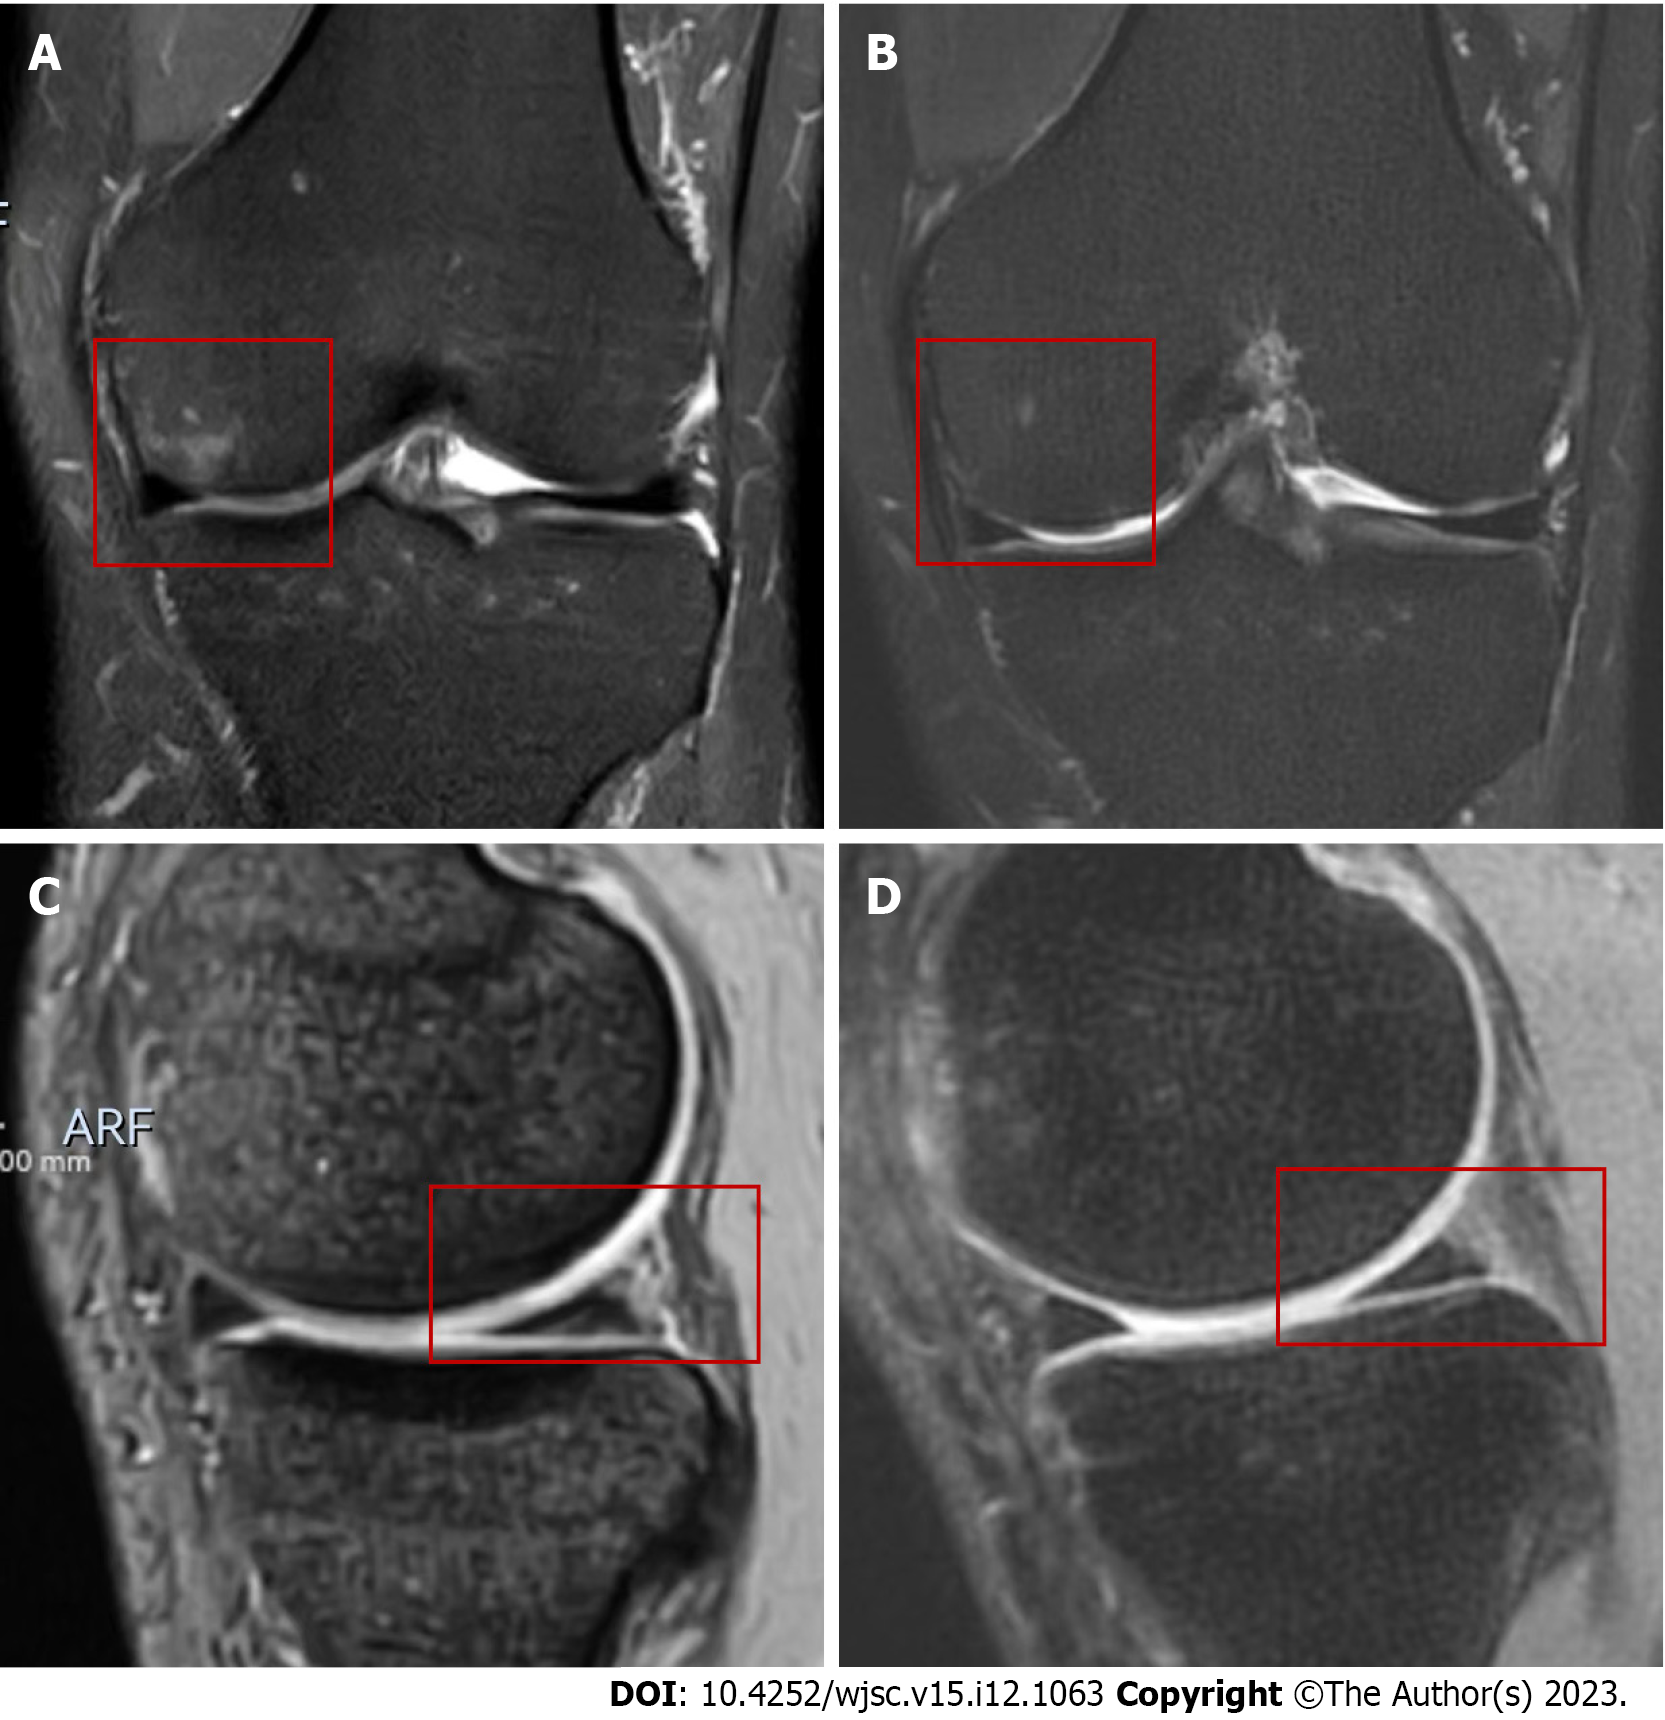
Figure 5 Magnetic resonance imaging evaluation of bone marrow lesions and meniscus tear changes at 24 mo.
A and C: Coronal and sagittal images of the medial femur and tibia before injection of microfragmented adipose tissue (MFAT). The bone marrow lesions (BML) and meniscus tears can be observed in the rectangle; B and D: Coronal and sagittal images of the medial femur and tibia 24 mo after MFAT injections. The BML in the rectangular area was reduced, and the meniscus injury was repaired. ARF: Anterior right inferior.
- Citation: Wu CZ, Shi ZY, Wu Z, Lin WJ, Chen WB, Jia XW, Xiang SC, Xu HH, Ge QW, Zou KA, Wang X, Chen JL, Wang PE, Yuan WH, Jin HT, Tong PJ. Mid-term outcomes of microfragmented adipose tissue plus arthroscopic surgery for knee osteoarthritis: A randomized, active-control, multicenter clinical trial. World J Stem Cells 2023; 15(12): 1063-1076
- URL: https://www.wjgnet.com/1948-0210/full/v15/i12/1063.htm
- DOI: https://dx.doi.org/10.4252/wjsc.v15.i12.1063


