
















©The Author(s) 2003.
World J Gastroenterol. May 15, 2003; 9(5): 1014-1019
Published online May 15, 2003. doi: 10.3748/wjg.v9.i5.1014
Published online May 15, 2003. doi: 10.3748/wjg.v9.i5.1014
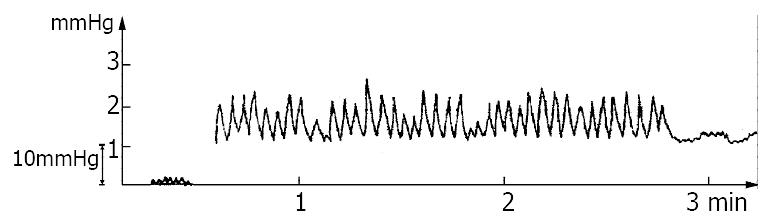
Figure 5 A pressure curves before MgSO4 solution infusion in the study group.
Signs of the pressure curves is similar to the control group in the mOS segment of bile duct.
- Citation: Wei JG, Wang YC, Liang GM, Wang W, Chen BY, Xu JK, Song LJ. The study between the dynamics and the X-ray anatomy and regularizing effect of gallbladder on bile duct sphincter of the dog. World J Gastroenterol 2003; 9(5): 1014-1019
- URL: https://www.wjgnet.com/1007-9327/full/v9/i5/1014.htm
- DOI: https://dx.doi.org/10.3748/wjg.v9.i5.1014