
















©The Author(s) 2003.
World J Gastroenterol. Dec 15, 2003; 9(12): 2732-2736
Published online Dec 15, 2003. doi: 10.3748/wjg.v9.i12.2732
Published online Dec 15, 2003. doi: 10.3748/wjg.v9.i12.2732
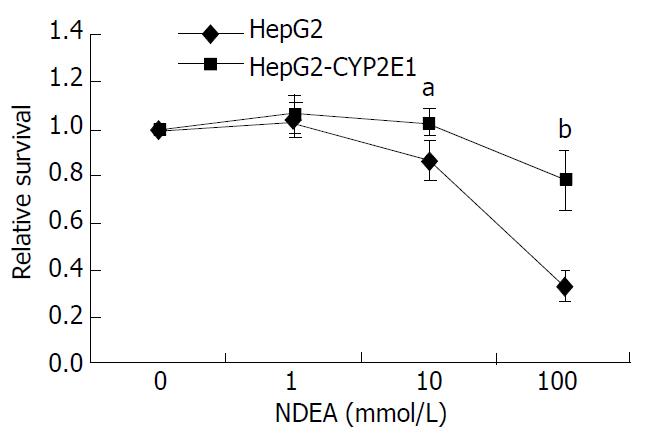
Figure 4 Cytotoxicity of NDEA against HepG2-CYP2E1 and HepG2 cells.
Cells were exposed to various concentrations of NDEA. Relative survival rate was represented as the relative toxicity to the control culture without NDEA. The results presented were the average of six duplications (-x±s). aP < 0.05, bP < 0.01 vs HepG2 cells.
- Citation: Zhuge J, Luo Y, Yu YN. Heterologous expression of human cytochrome P450 2E1 in HepG2 cell line. World J Gastroenterol 2003; 9(12): 2732-2736
- URL: https://www.wjgnet.com/1007-9327/full/v9/i12/2732.htm
- DOI: https://dx.doi.org/10.3748/wjg.v9.i12.2732