
















Copyright: ©Author(s) 2026.
World J Gastroenterol. Jan 14, 2027; 33(2): 123951
Published online Jan 14, 2027. doi: 10.3748/wjg.123951
Published online Jan 14, 2027. doi: 10.3748/wjg.123951
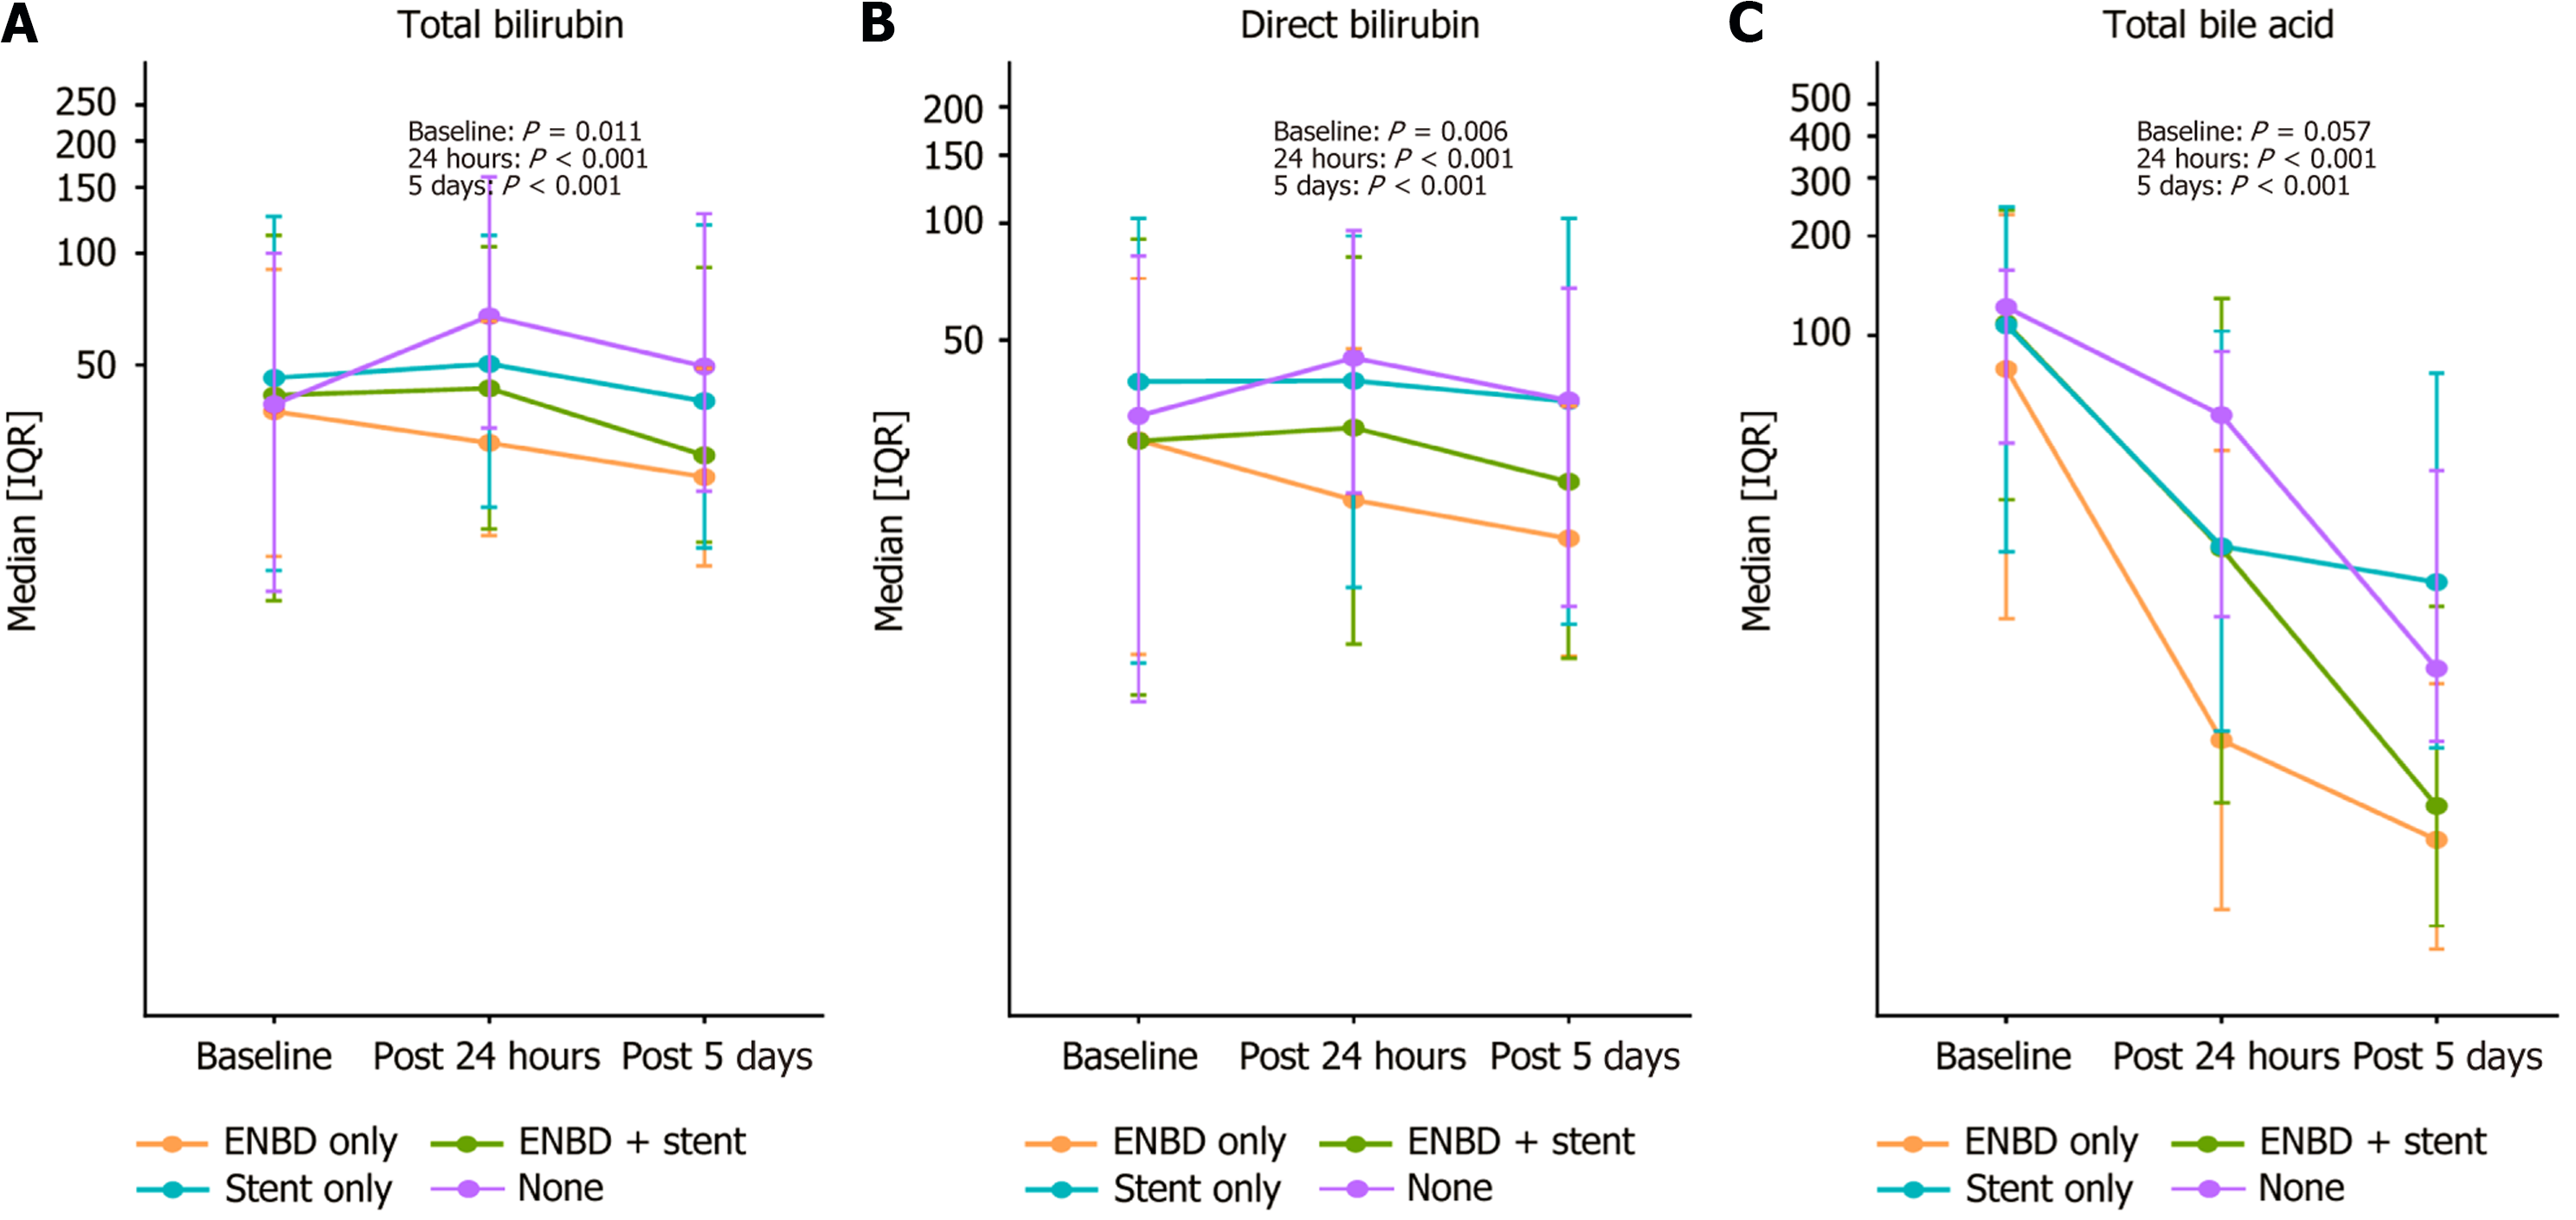
Figure 4 Marker trajectories stratified by drainage strategy.
A: Total bilirubin trajectories according to drainage strategy; B: Direct bilirubin trajectories according to drainage strategy; C: Total bile acid trajectories according to drainage strategy. Median values with interquartile ranges are shown at baseline, within 24 hours after endoscopic retrograde cholangiopancreatography, and within 5 days after endoscopic retrograde cholangiopancreatography. IQR: Interquartile range; ENBD: Endoscopic nasobiliary drainage.
- Citation: Liao GL, Wei HX, Qin JF, Qin F, Wang J, Liu SQ, Huang JA, Qin MB. Total bile acid better reflects the early biochemical biliary drainage response after endoscopic retrograde cholangiopancreatography. World J Gastroenterol 2027; 33(2): 123951
- URL: https://www.wjgnet.com/1007-9327/full/v33/i2/123951.htm
- DOI: https://dx.doi.org/10.3748/wjg.123951