
















Copyright: ©Author(s) 2026.
World J Gastroenterol. Jan 14, 2027; 33(2): 123795
Published online Jan 14, 2027. doi: 10.3748/wjg.123795
Published online Jan 14, 2027. doi: 10.3748/wjg.123795
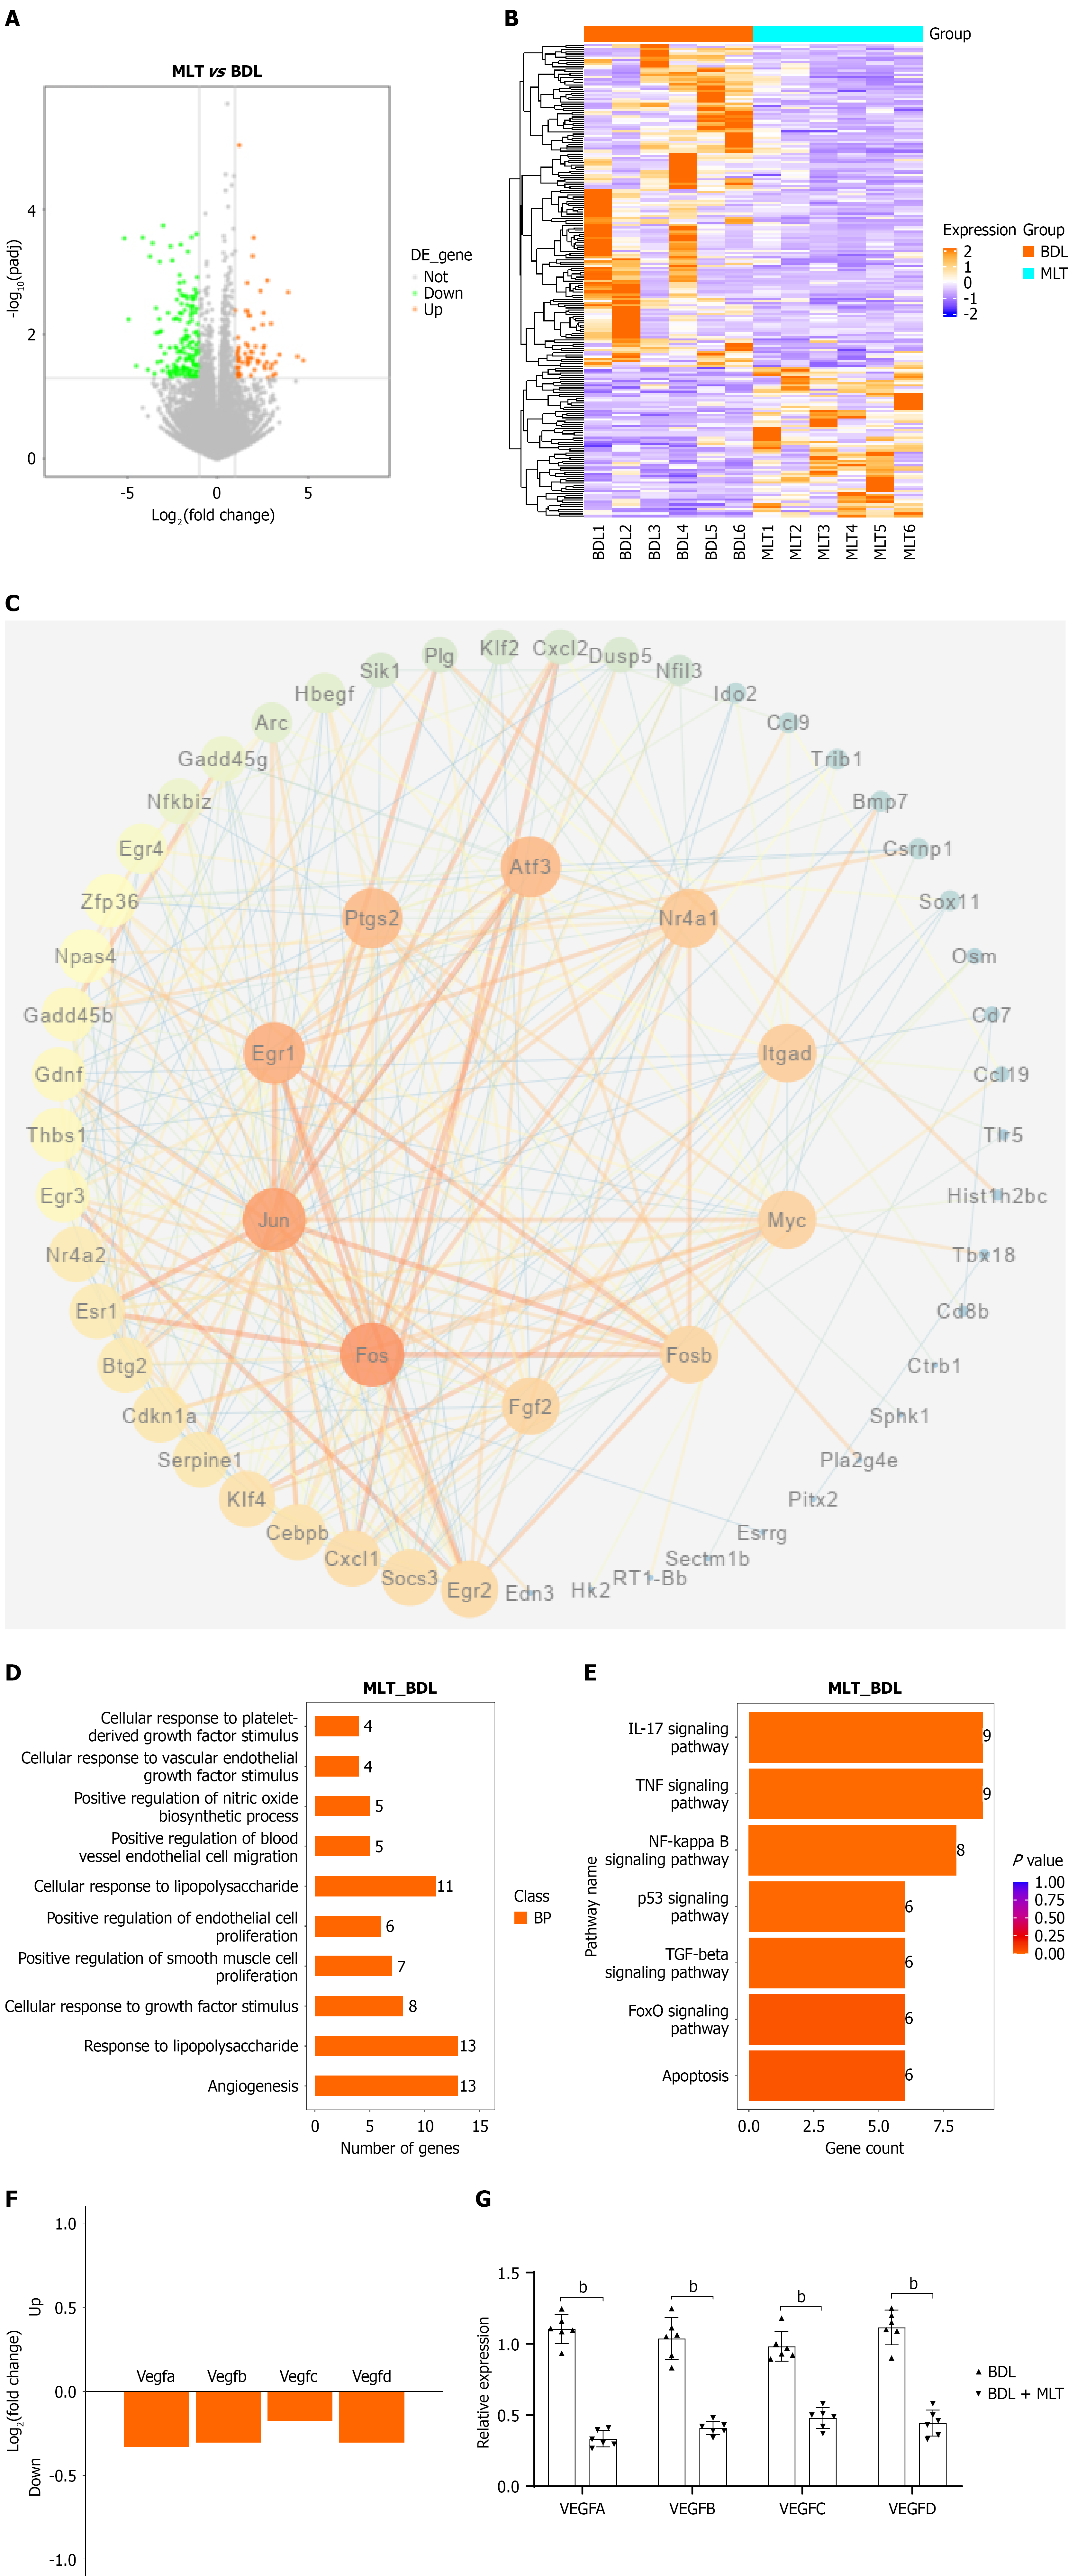
Figure 3 RNA-sequencing of mesenteric arteries from bile duct ligation rats treated with melatonin.
A: The volcano plot of differential expressed genes (DEGs) between bile duct ligation (BDL) and BDL + melatonin (MLT) groups; B: The heatmap of DEGs between BDL and BDL + MLT groups; C: The protein-protein interaction network of DEGs with 10 hub genes; D: The top 10 terms enriched by Gene Ontology enrichment analysis based on DEGs; E: The top 10 pathways enriched by Kyoto Encyclopedia of Genes and Genomes analysis based on DEGs; F: The expression profile of VEGFs between BDL and BDL + MLT groups; G: The validation of the expression levels of VEGFs by quantitative real-time polymerase chain reaction. aP < 0.05. bP < 0.01. BDL: Bile duct ligation; MLT: Melatonin.
- Citation: Wu GB, Luo GQ, Chen M, Cai KW, You XT, Han F, Zhang NZ, Luo M, Li Q, Huo HZ, Fan Q. Melatonin attenuates splanchnic hyperdynamic circulation in cirrhotic portal hypertension by disrupting POMK-VEGFR2 interaction. World J Gastroenterol 2027; 33(2): 123795
- URL: https://www.wjgnet.com/1007-9327/full/v33/i2/123795.htm
- DOI: https://dx.doi.org/10.3748/wjg.123795