
















Copyright: ©Author(s) 2026.
World J Gastroenterol. Jan 14, 2027; 33(2): 123195
Published online Jan 14, 2027. doi: 10.3748/wjg.123195
Published online Jan 14, 2027. doi: 10.3748/wjg.123195
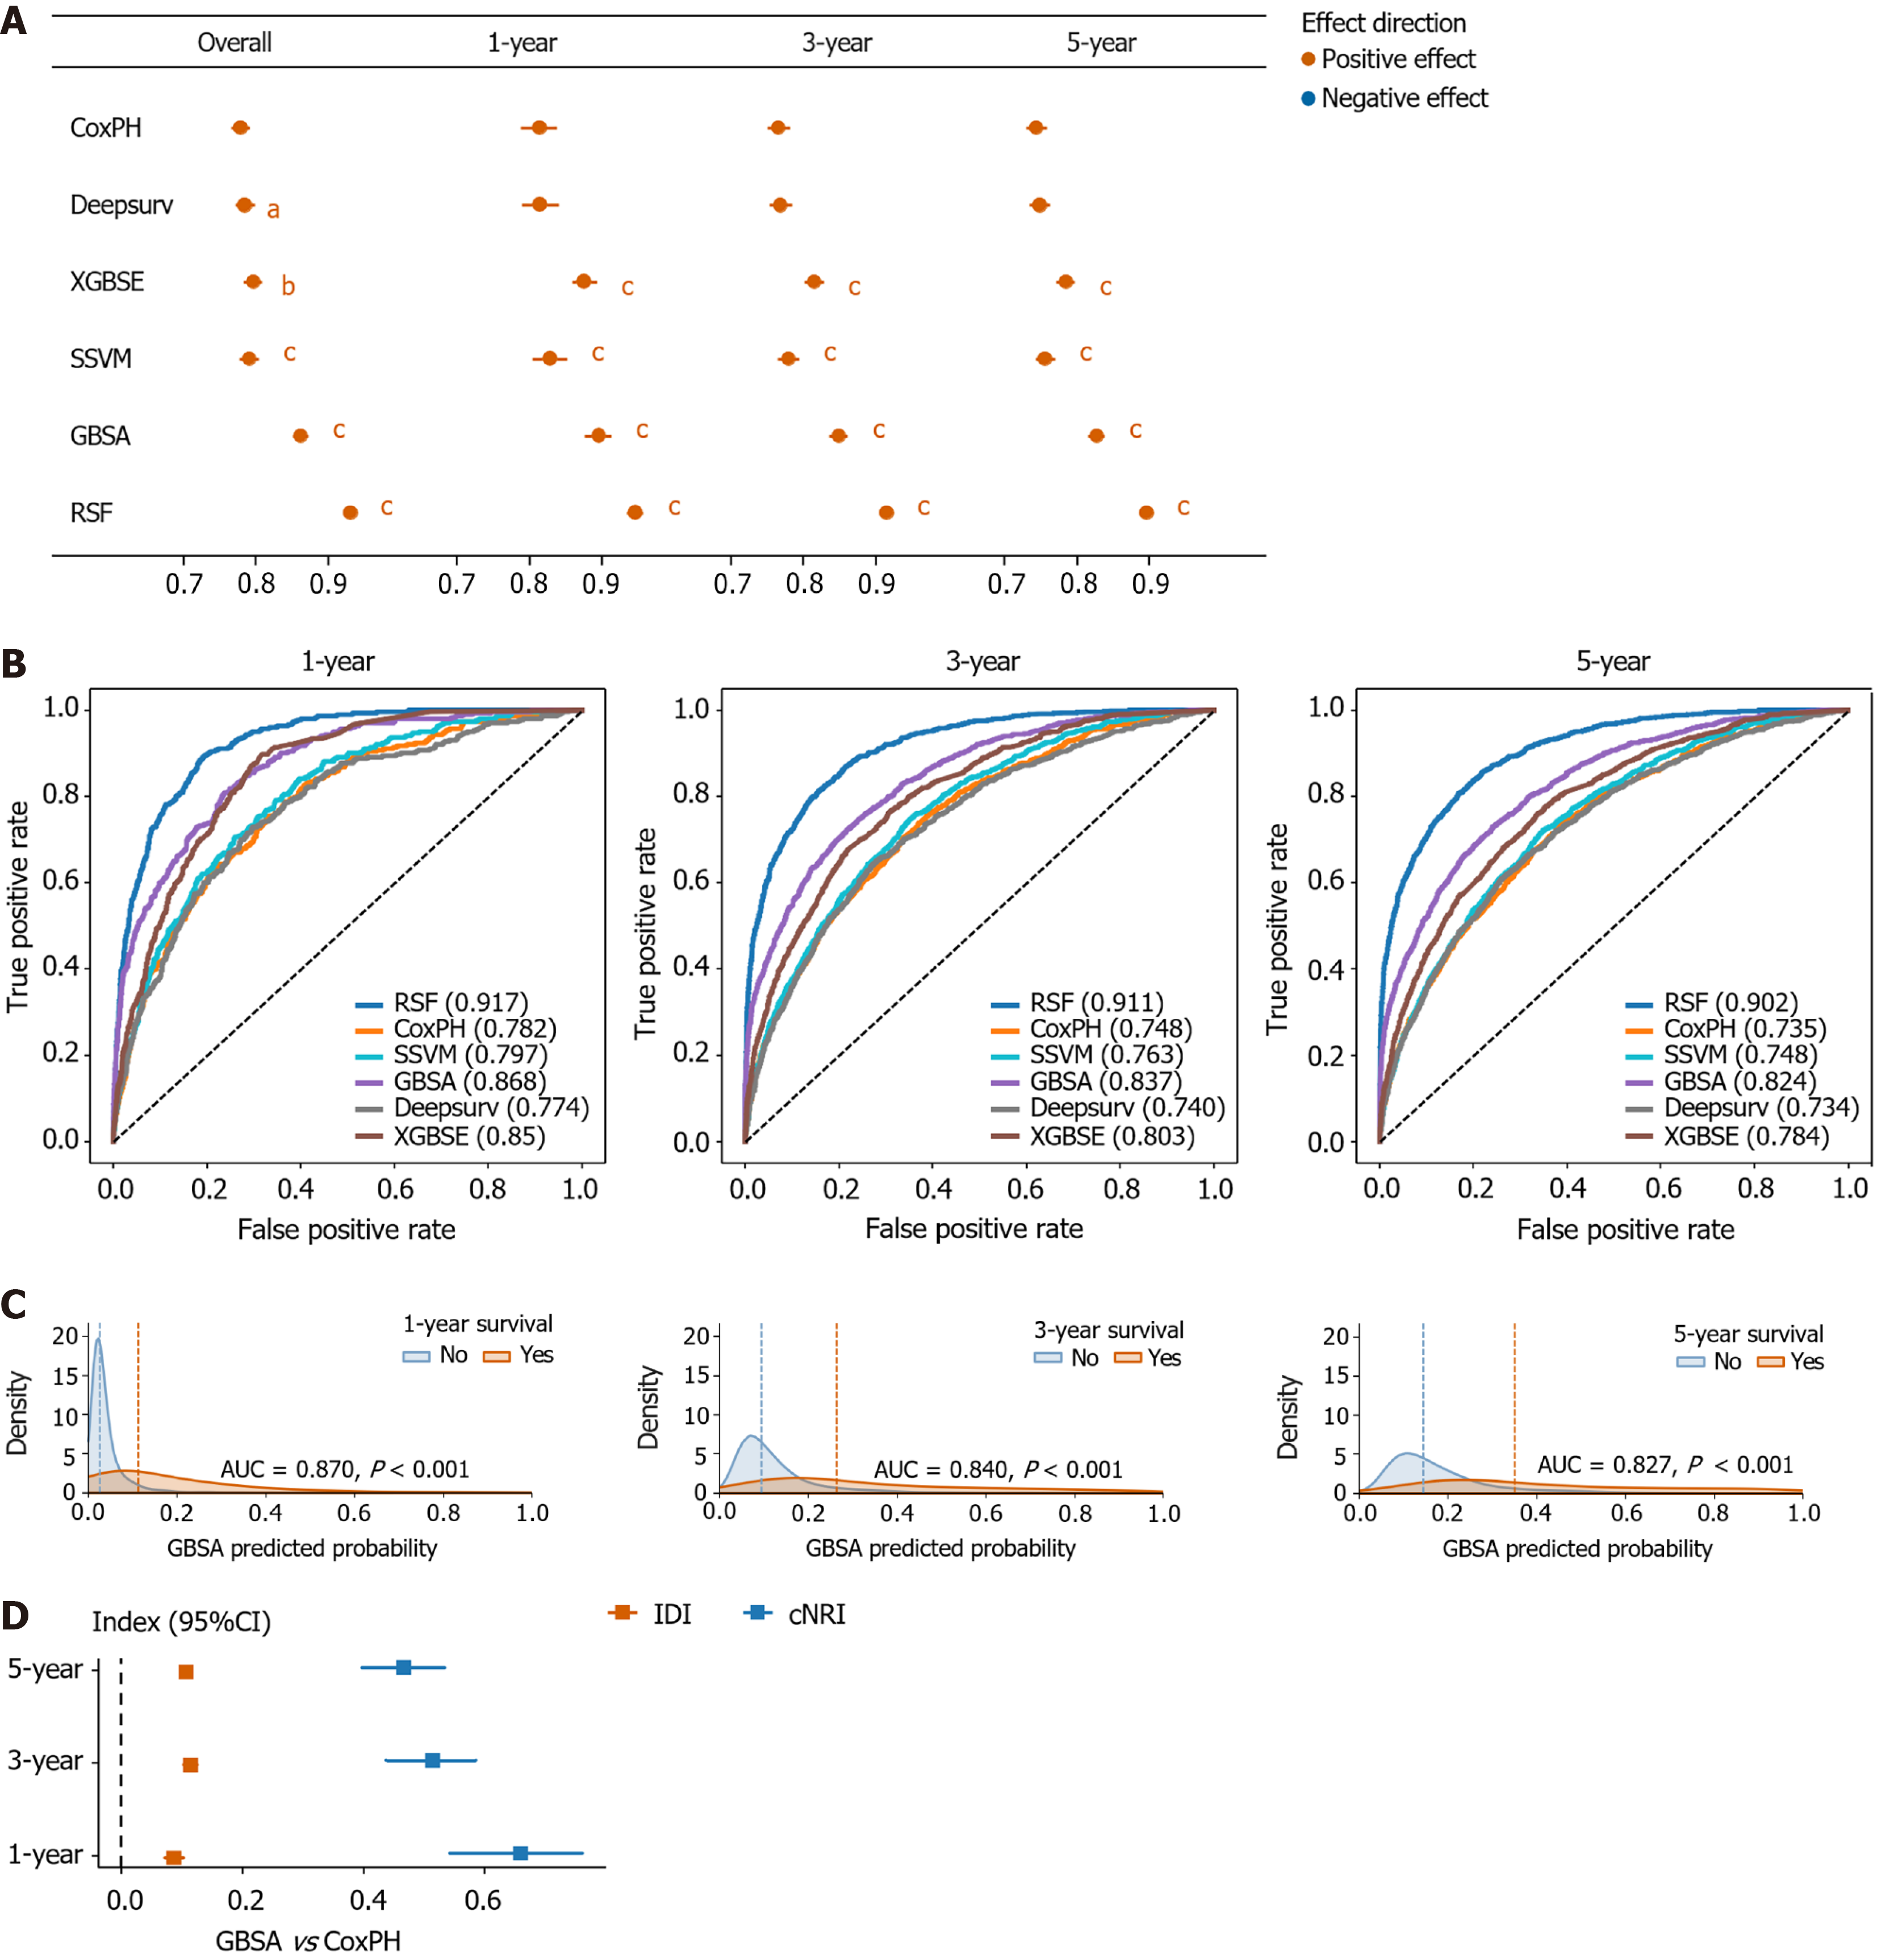
Figure 5 Performance of the prognostic models in the training cohort.
A: Harrell’s concordance index values at overall, 1-year, 3-year, and 5-year time points across models; B: Time-dependent receiver operating characteristic curves at 1-year, 3-year, and 5-year across models; C: Probability density function plots of the gradient boosting survival analysis (GBSA) model for 1-year, 3-year, and 5-year survival prediction; D: Integrated discrimination improvement and continuous net reclassification improvement of the GBSA model compared with the Cox proportional hazards model for 1-year, 3-year, and 5-year survival prediction. aP < 0.05. bP < 0.01. cP < 0.001. AUC: Area under the curve; CI: Confidence interval; cNRI: Continuous net reclassification improvement; CoxPH: Cox proportional hazards; GBSA: Gradient boosting survival analysis; IDI: Integrated discrimination improvement; RSF: Random survival forest; SSVM: Survival support vector machine; XGBSE: EXtreme gradient boosting for survival embeddings.
- Citation: Wang L, Liu C, Xie J, Liu JS, Zhou X, Liu F, Xiang CY, Zhao JN, Liu XR, Liu XY, Kang B, Cheng Y, Peng D. Integrating immune-inflammatory and nutritional indicators into machine learning-driven risk stratification for colorectal cancer. World J Gastroenterol 2027; 33(2): 123195
- URL: https://www.wjgnet.com/1007-9327/full/v33/i2/123195.htm
- DOI: https://dx.doi.org/10.3748/wjg.123195