
















Copyright: ©Author(s) 2026.
World J Gastroenterol. Jan 14, 2027; 33(2): 123092
Published online Jan 14, 2027. doi: 10.3748/wjg.123092
Published online Jan 14, 2027. doi: 10.3748/wjg.123092
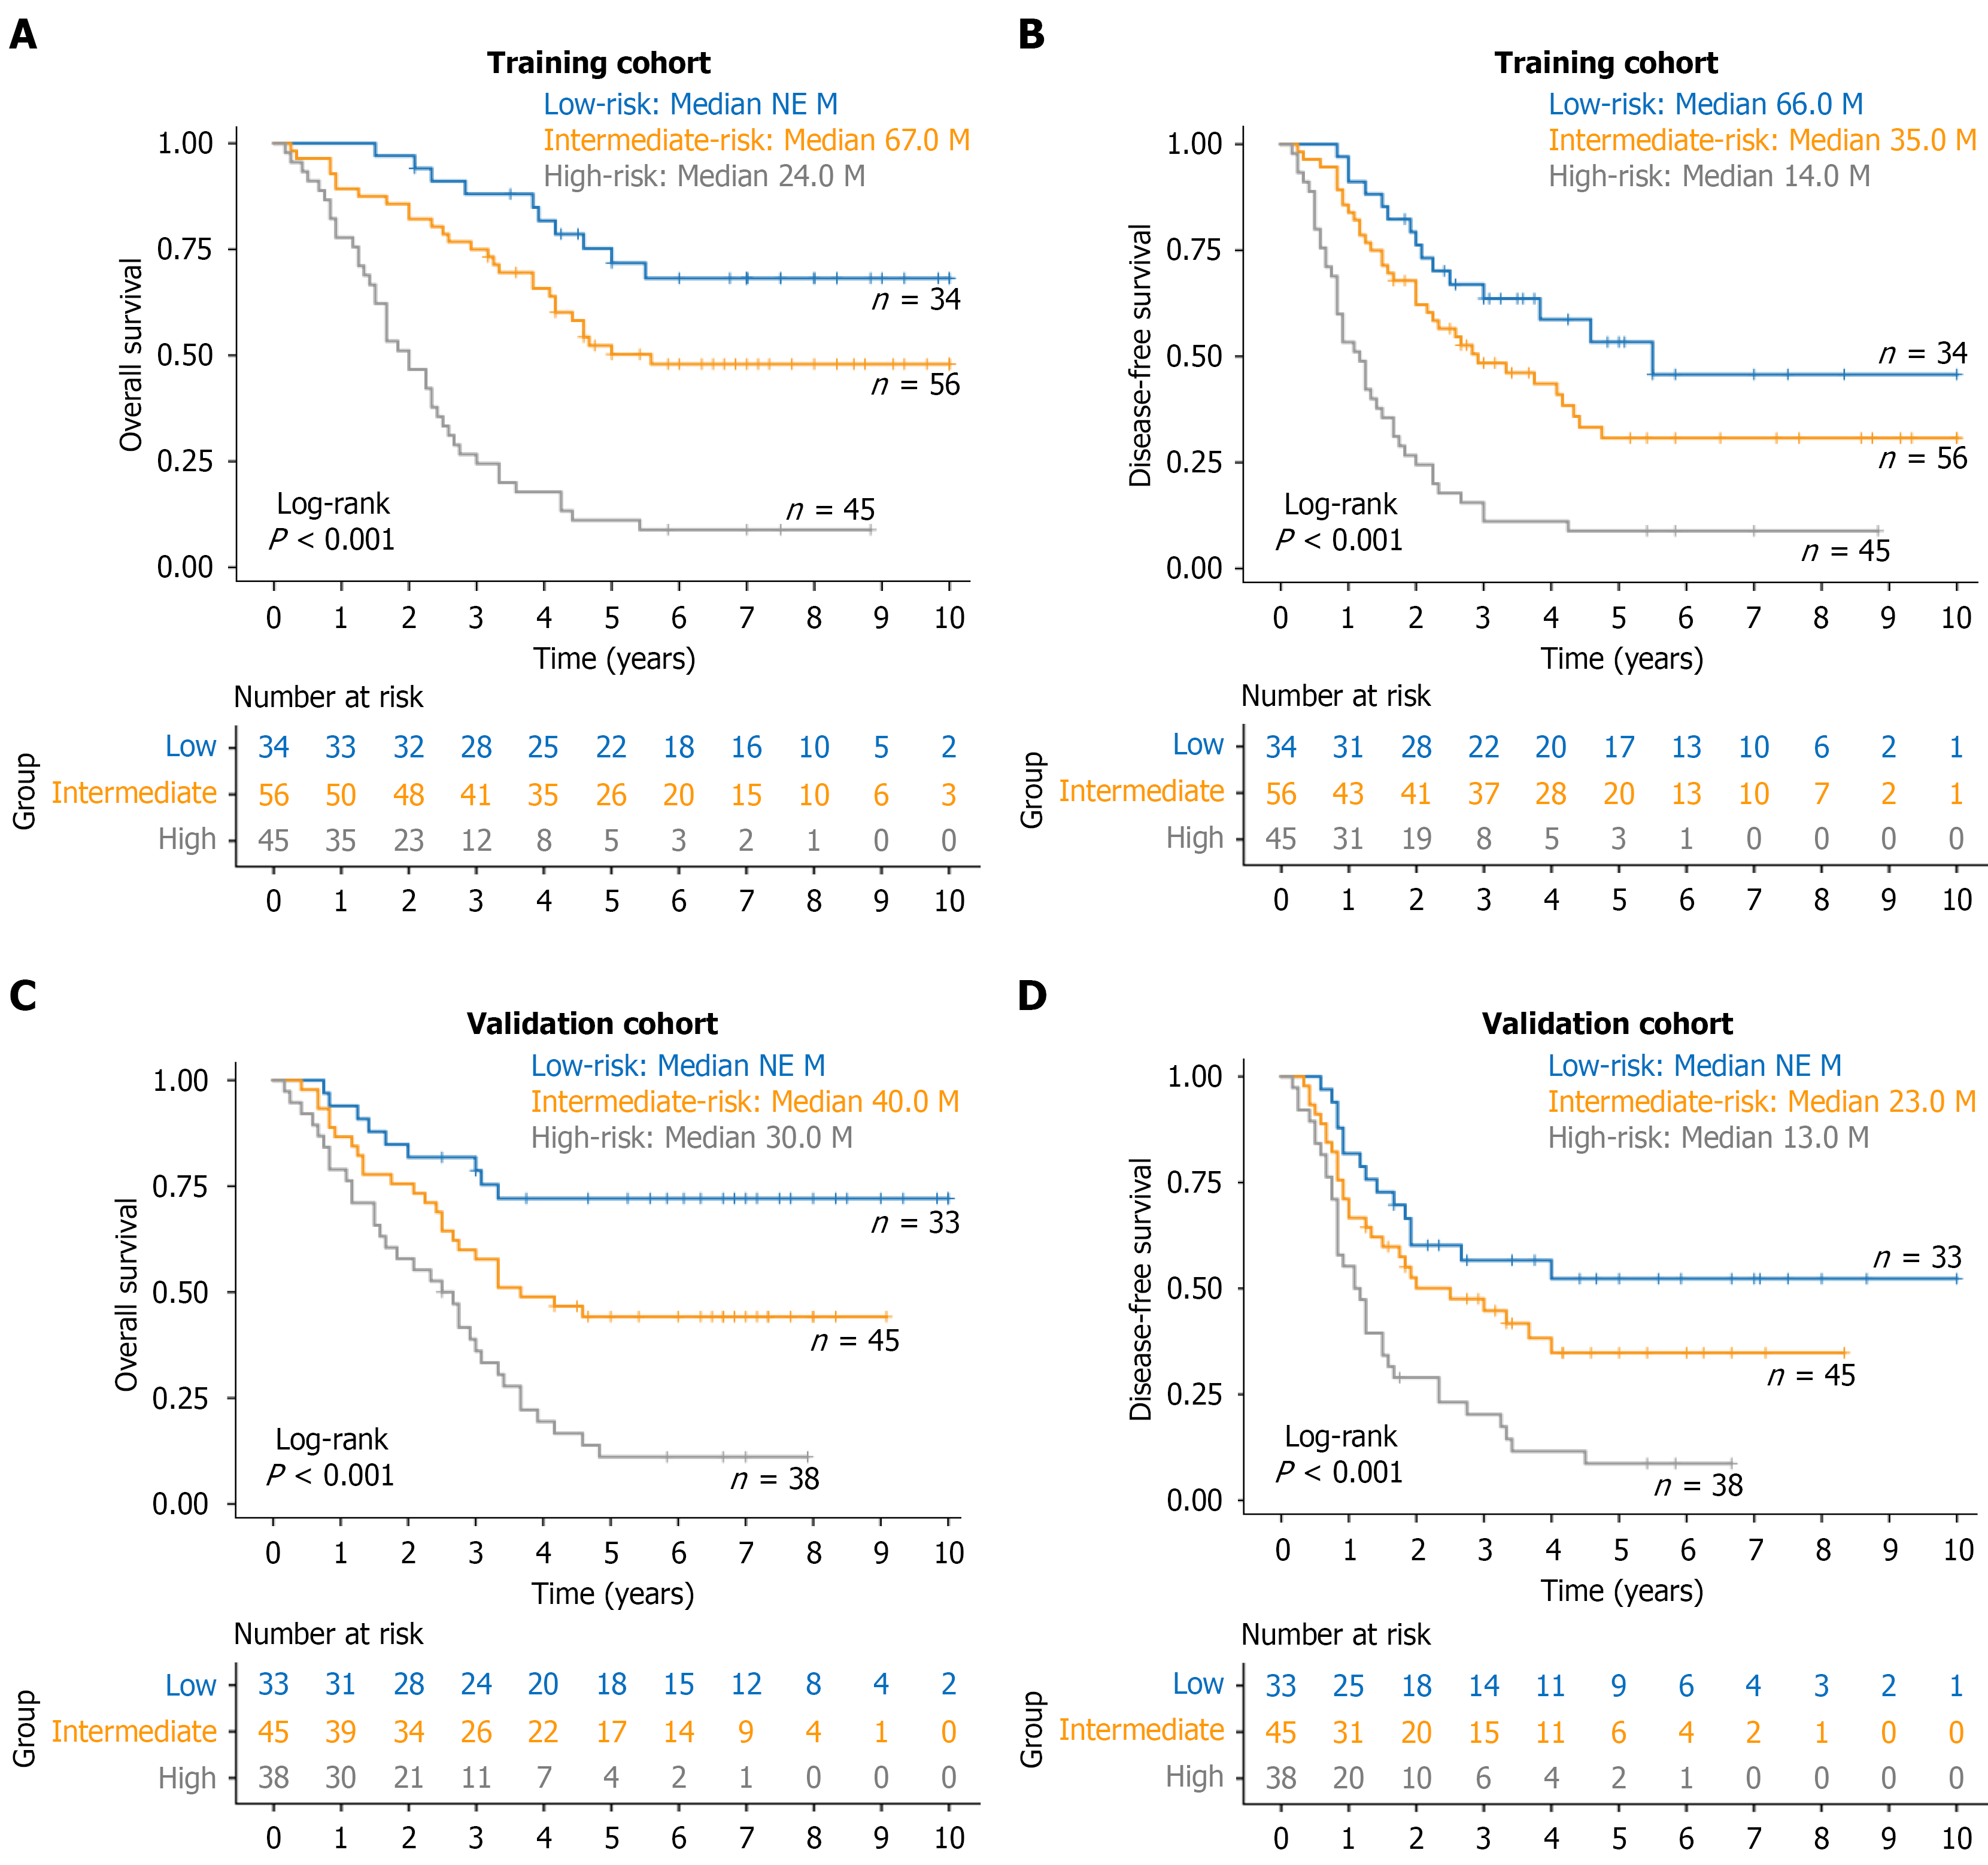
Figure 4 Prediction of overall survival and disease-free survival based on the TGN scoring model.
Kaplan-Meier curves illustrated overall survival and disease-free survival differences stratified by the TGN model, which classified patients into low-, intermediate-, and high-risk groups. Median survival and log-rank P values between groups were shown. A and B: Training cohort; C and D: Validation cohort. NE: Not evaluable; M: Months.
- Citation: Liao MJ, Zhou Y, Wang ZL, Wang XX, Ai X, Song LN, Fei R, Cong X, Liu F, Zhu PP, Chen HS, Liao WJ, Rao HY. Development and validation of a prognostic prediction model for alpha-fetoprotein-negative hepatocellular carcinoma with microvascular invasion after surgery. World J Gastroenterol 2027; 33(2): 123092
- URL: https://www.wjgnet.com/1007-9327/full/v33/i2/123092.htm
- DOI: https://dx.doi.org/10.3748/wjg.123092