
















Copyright: ©Author(s) 2026.
World J Gastroenterol. Jan 14, 2027; 33(2): 122338
Published online Jan 14, 2027. doi: 10.3748/wjg.122338
Published online Jan 14, 2027. doi: 10.3748/wjg.122338
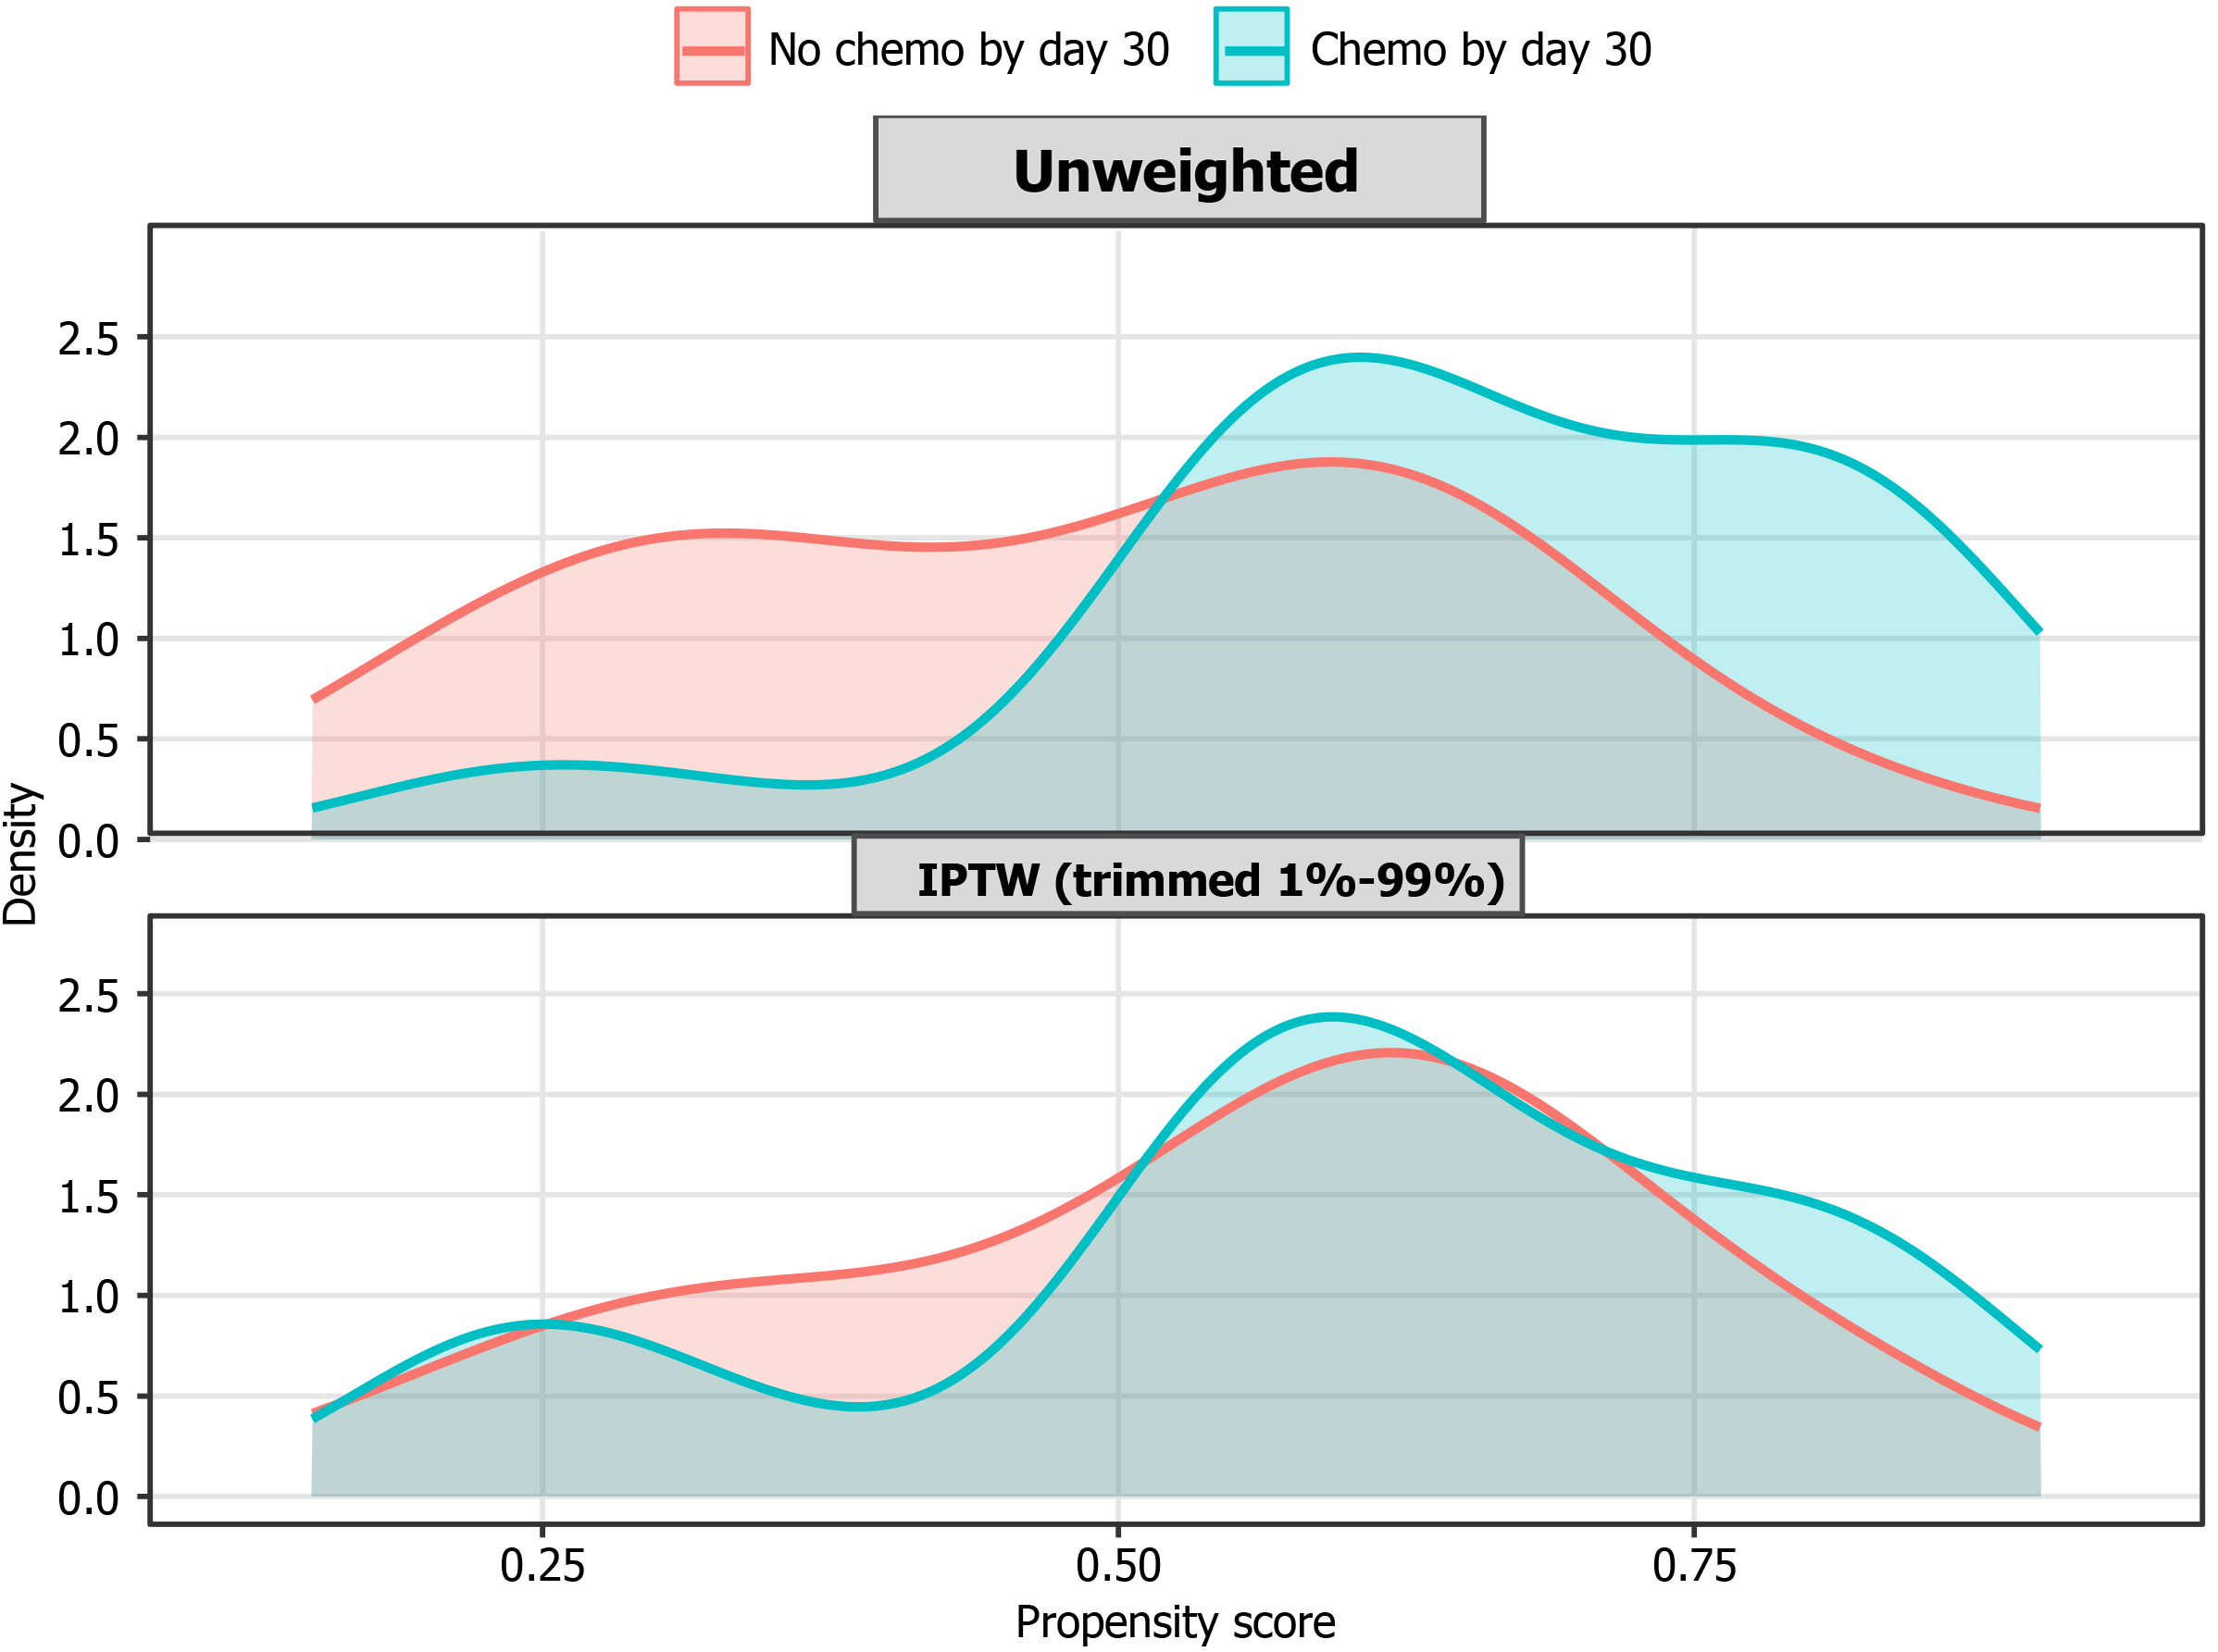
Figure 2 Propensity score distributions before and after inverse probability of treatment weighting.
Density plots showing the propensity score distributions of the no-chemo-by-day-30 group and the chemo-by-day-30 group before weighting and after stabilized inverse probability of treatment weighting with 1% and 99% truncation. It is presented to show the overlap of the propensity score distributions between groups. IPTW: Inverse probability of treatment weighting.
- Citation: Liao YX, Cao MY, Chen YF, Yang Q, Lin SY, Li Y, Weng J, Huang XX, Gao XY, Wang GB, Li JJ, Shan HB. Early chemotherapy after endoscopic retrograde cholangiopancreatography and survival in advanced pancreatic cancer with biliary obstruction. World J Gastroenterol 2027; 33(2): 122338
- URL: https://www.wjgnet.com/1007-9327/full/v33/i2/122338.htm
- DOI: https://dx.doi.org/10.3748/wjg.122338