
















Copyright: ©Author(s) 2027.
World J Gastroenterol. Jan 7, 2027; 33(1): 123034
Published online Jan 7, 2027. doi: 10.3748/wjg.123034
Published online Jan 7, 2027. doi: 10.3748/wjg.123034
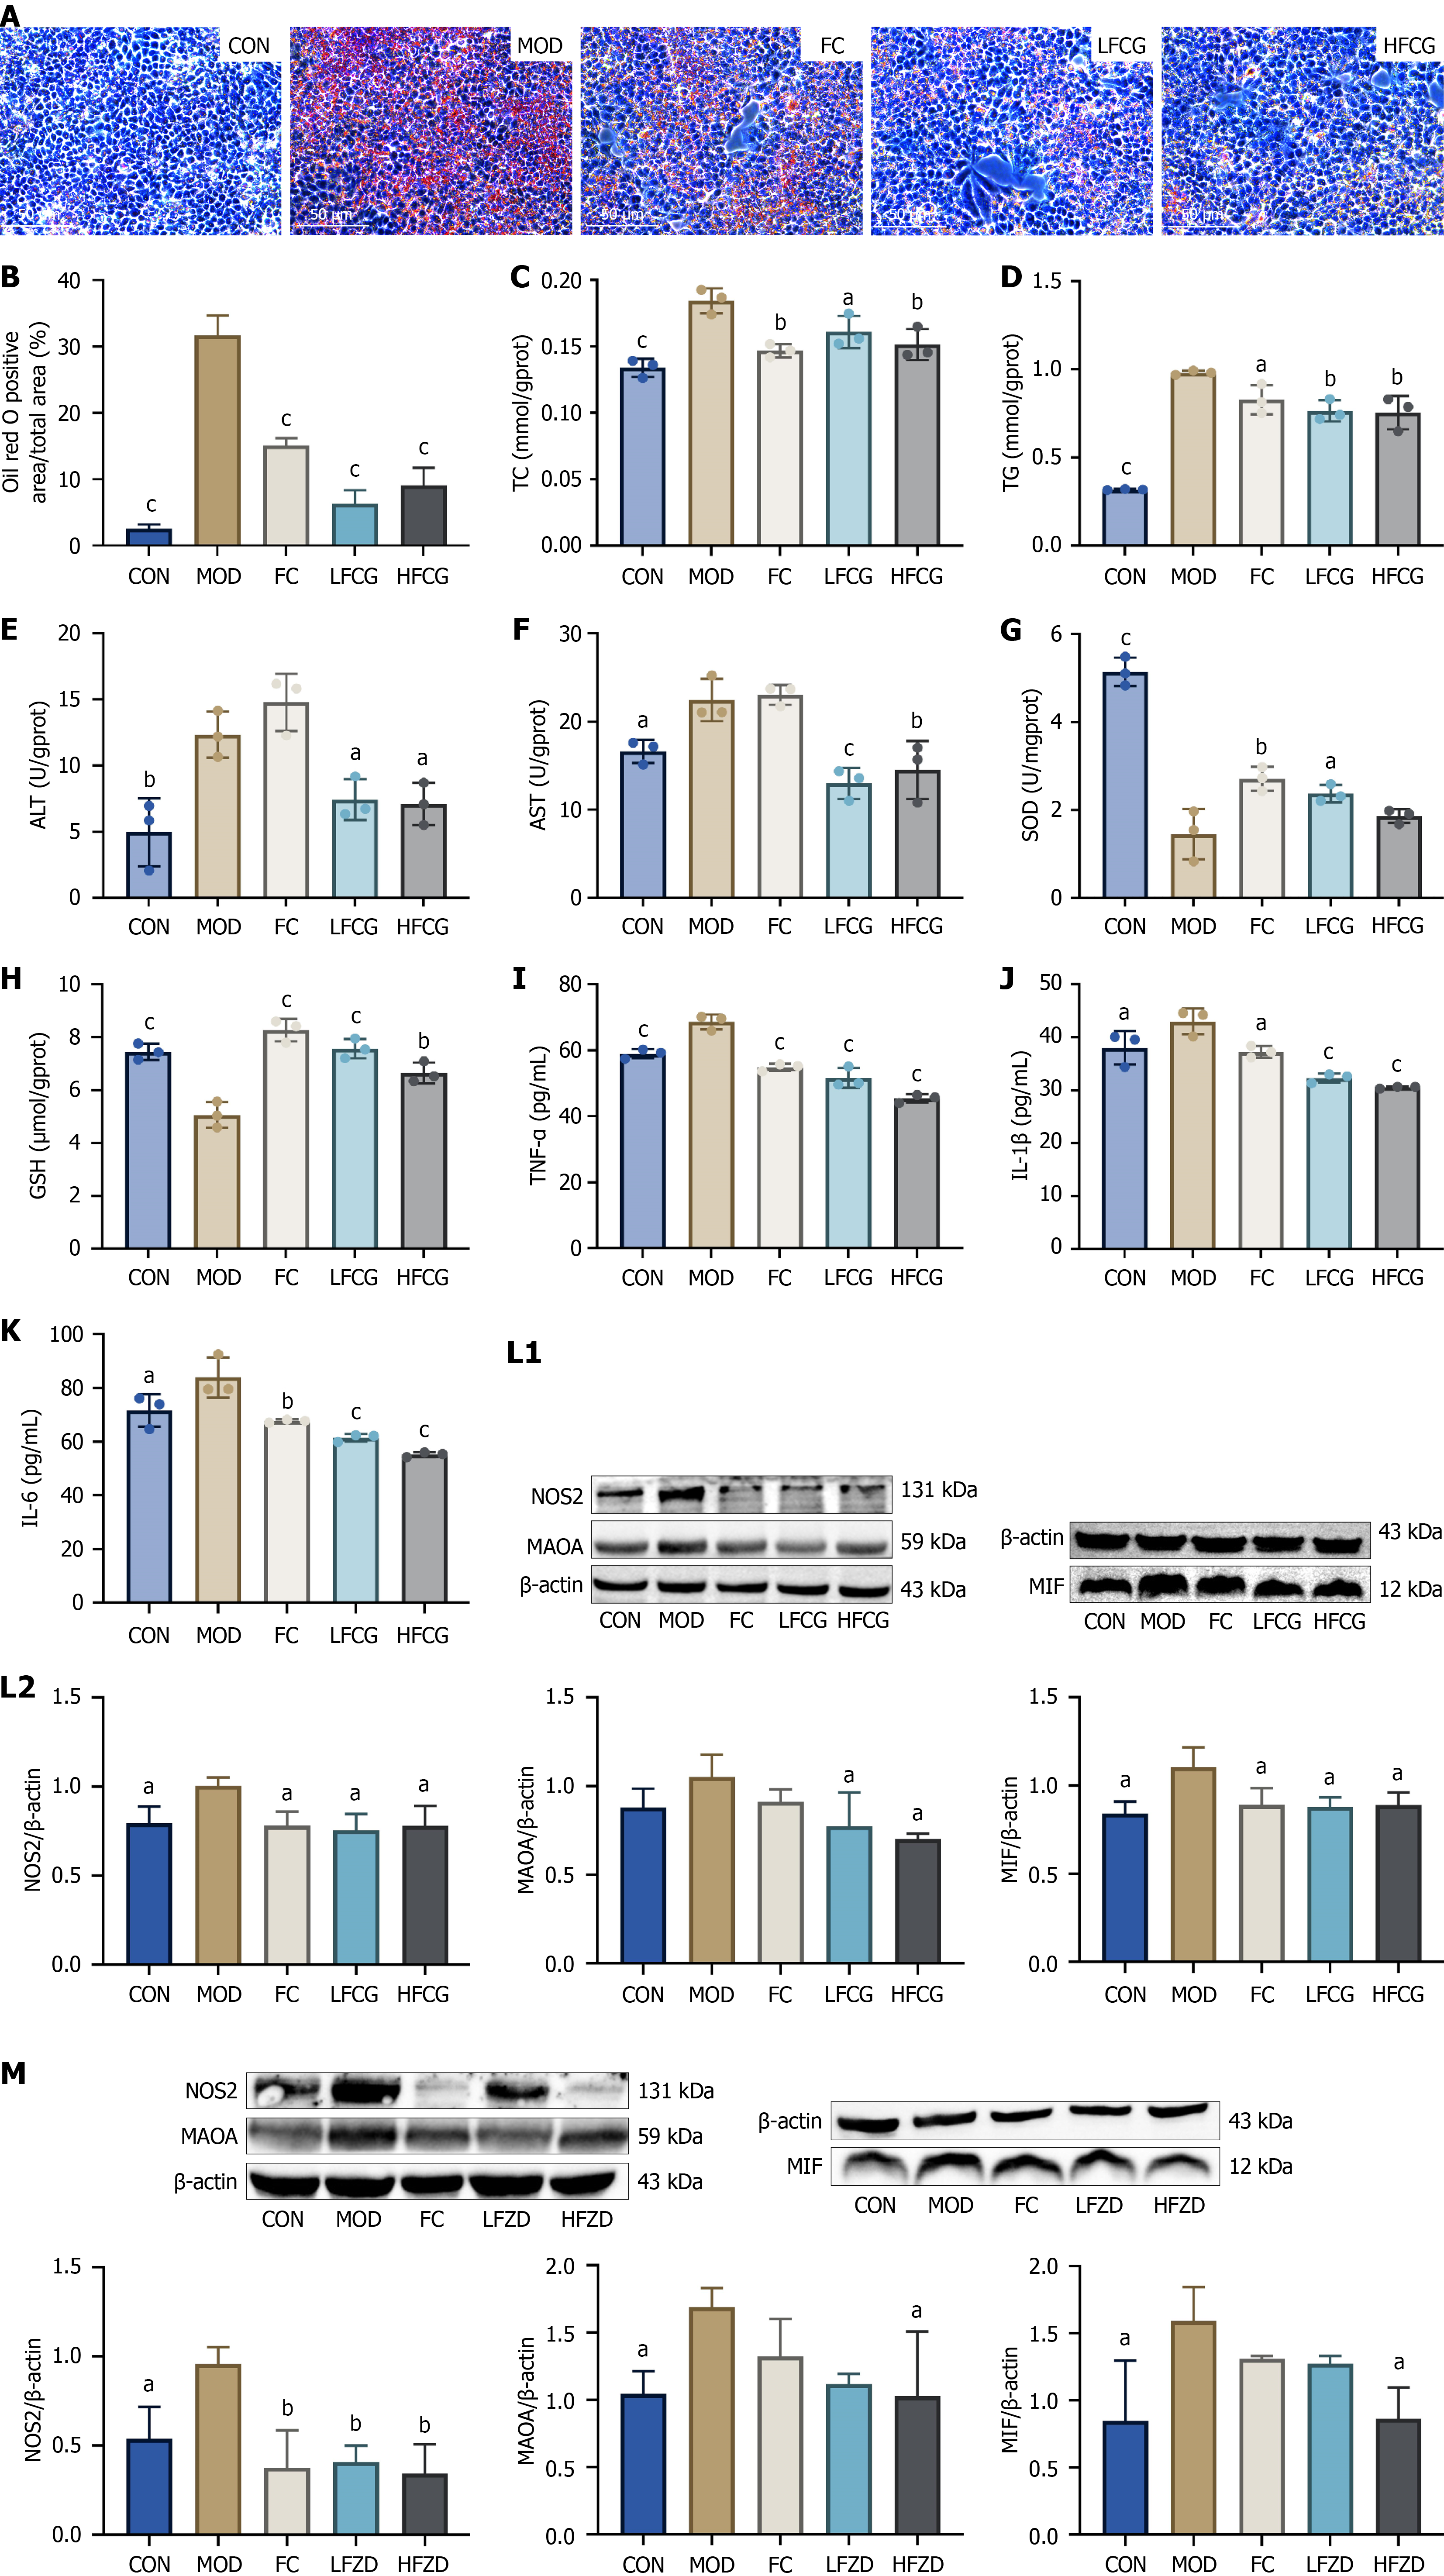
Figure 7 Effect of Fuling Zexie decoction-derived key active compounds on free fatty acid-induced HepG2 cells.
A: Oil red O stained sections (scale bar = 50 μm); B: Analysis of relative lipid droplet content; C-K: Total cholesterol (C), triglyceride (D), alanine aminotransferase (E), aspartate aminotransferase (F), superoxide dismutase (G), glutathione (H), tumor necrosis factor-α (I), interleukin (IL)-1β (J), IL-6 (K) levels in the free fatty acid-induced HepG2 cells; L: The expression of NOS2, MAOA and MIF in HepG2 cells after Fuling Zexie decoction (FZD)-derived key compound group treatment; M: The expression of NOS2, MAOA and MIF in the liver of rats with metabolic dysfunction-associated steatotic liver disease after FZD treatment. aP < 0.05. bP < 0.01. cP < 0.001. All P values vs the model group. CON: Control group; MOD: Model group; FC: Fenofibrate capsules group; HFCG: High-dose Fuling Zexie decoction-derived key compound group; LFCG: Low-dose Fuling Zexie decoction-derived key compound group; TC: Total cholesterol; TG: Triglyceride; ALT: Alanine aminotransferase; AST: Aspartate aminotransferase; SOD: Superoxide dismutase; GSH: Glutathione; TNF: Tumor necrosis factor; HFZD: High-dose Fuling Zexie decoction group; LFZD: Low-dose Fuling Zexie decoction group.
- Citation: Wang PQ, Yang H, Tang YM, Tao YX, Han SC, Zhou QD, Yu J, Yang XX. Mechanisms of Fuling Zexie decoction against metabolic dysfunction-associated steatotic liver disease: Integrative metabolomics, gut microbiota and serum pharmacochemistry. World J Gastroenterol 2027; 33(1): 123034
- URL: https://www.wjgnet.com/1007-9327/full/v33/i1/123034.htm
- DOI: https://dx.doi.org/10.3748/wjg.123034