
















Copyright: ©Author(s) 2027.
World J Gastroenterol. Jan 7, 2027; 33(1): 123034
Published online Jan 7, 2027. doi: 10.3748/wjg.123034
Published online Jan 7, 2027. doi: 10.3748/wjg.123034
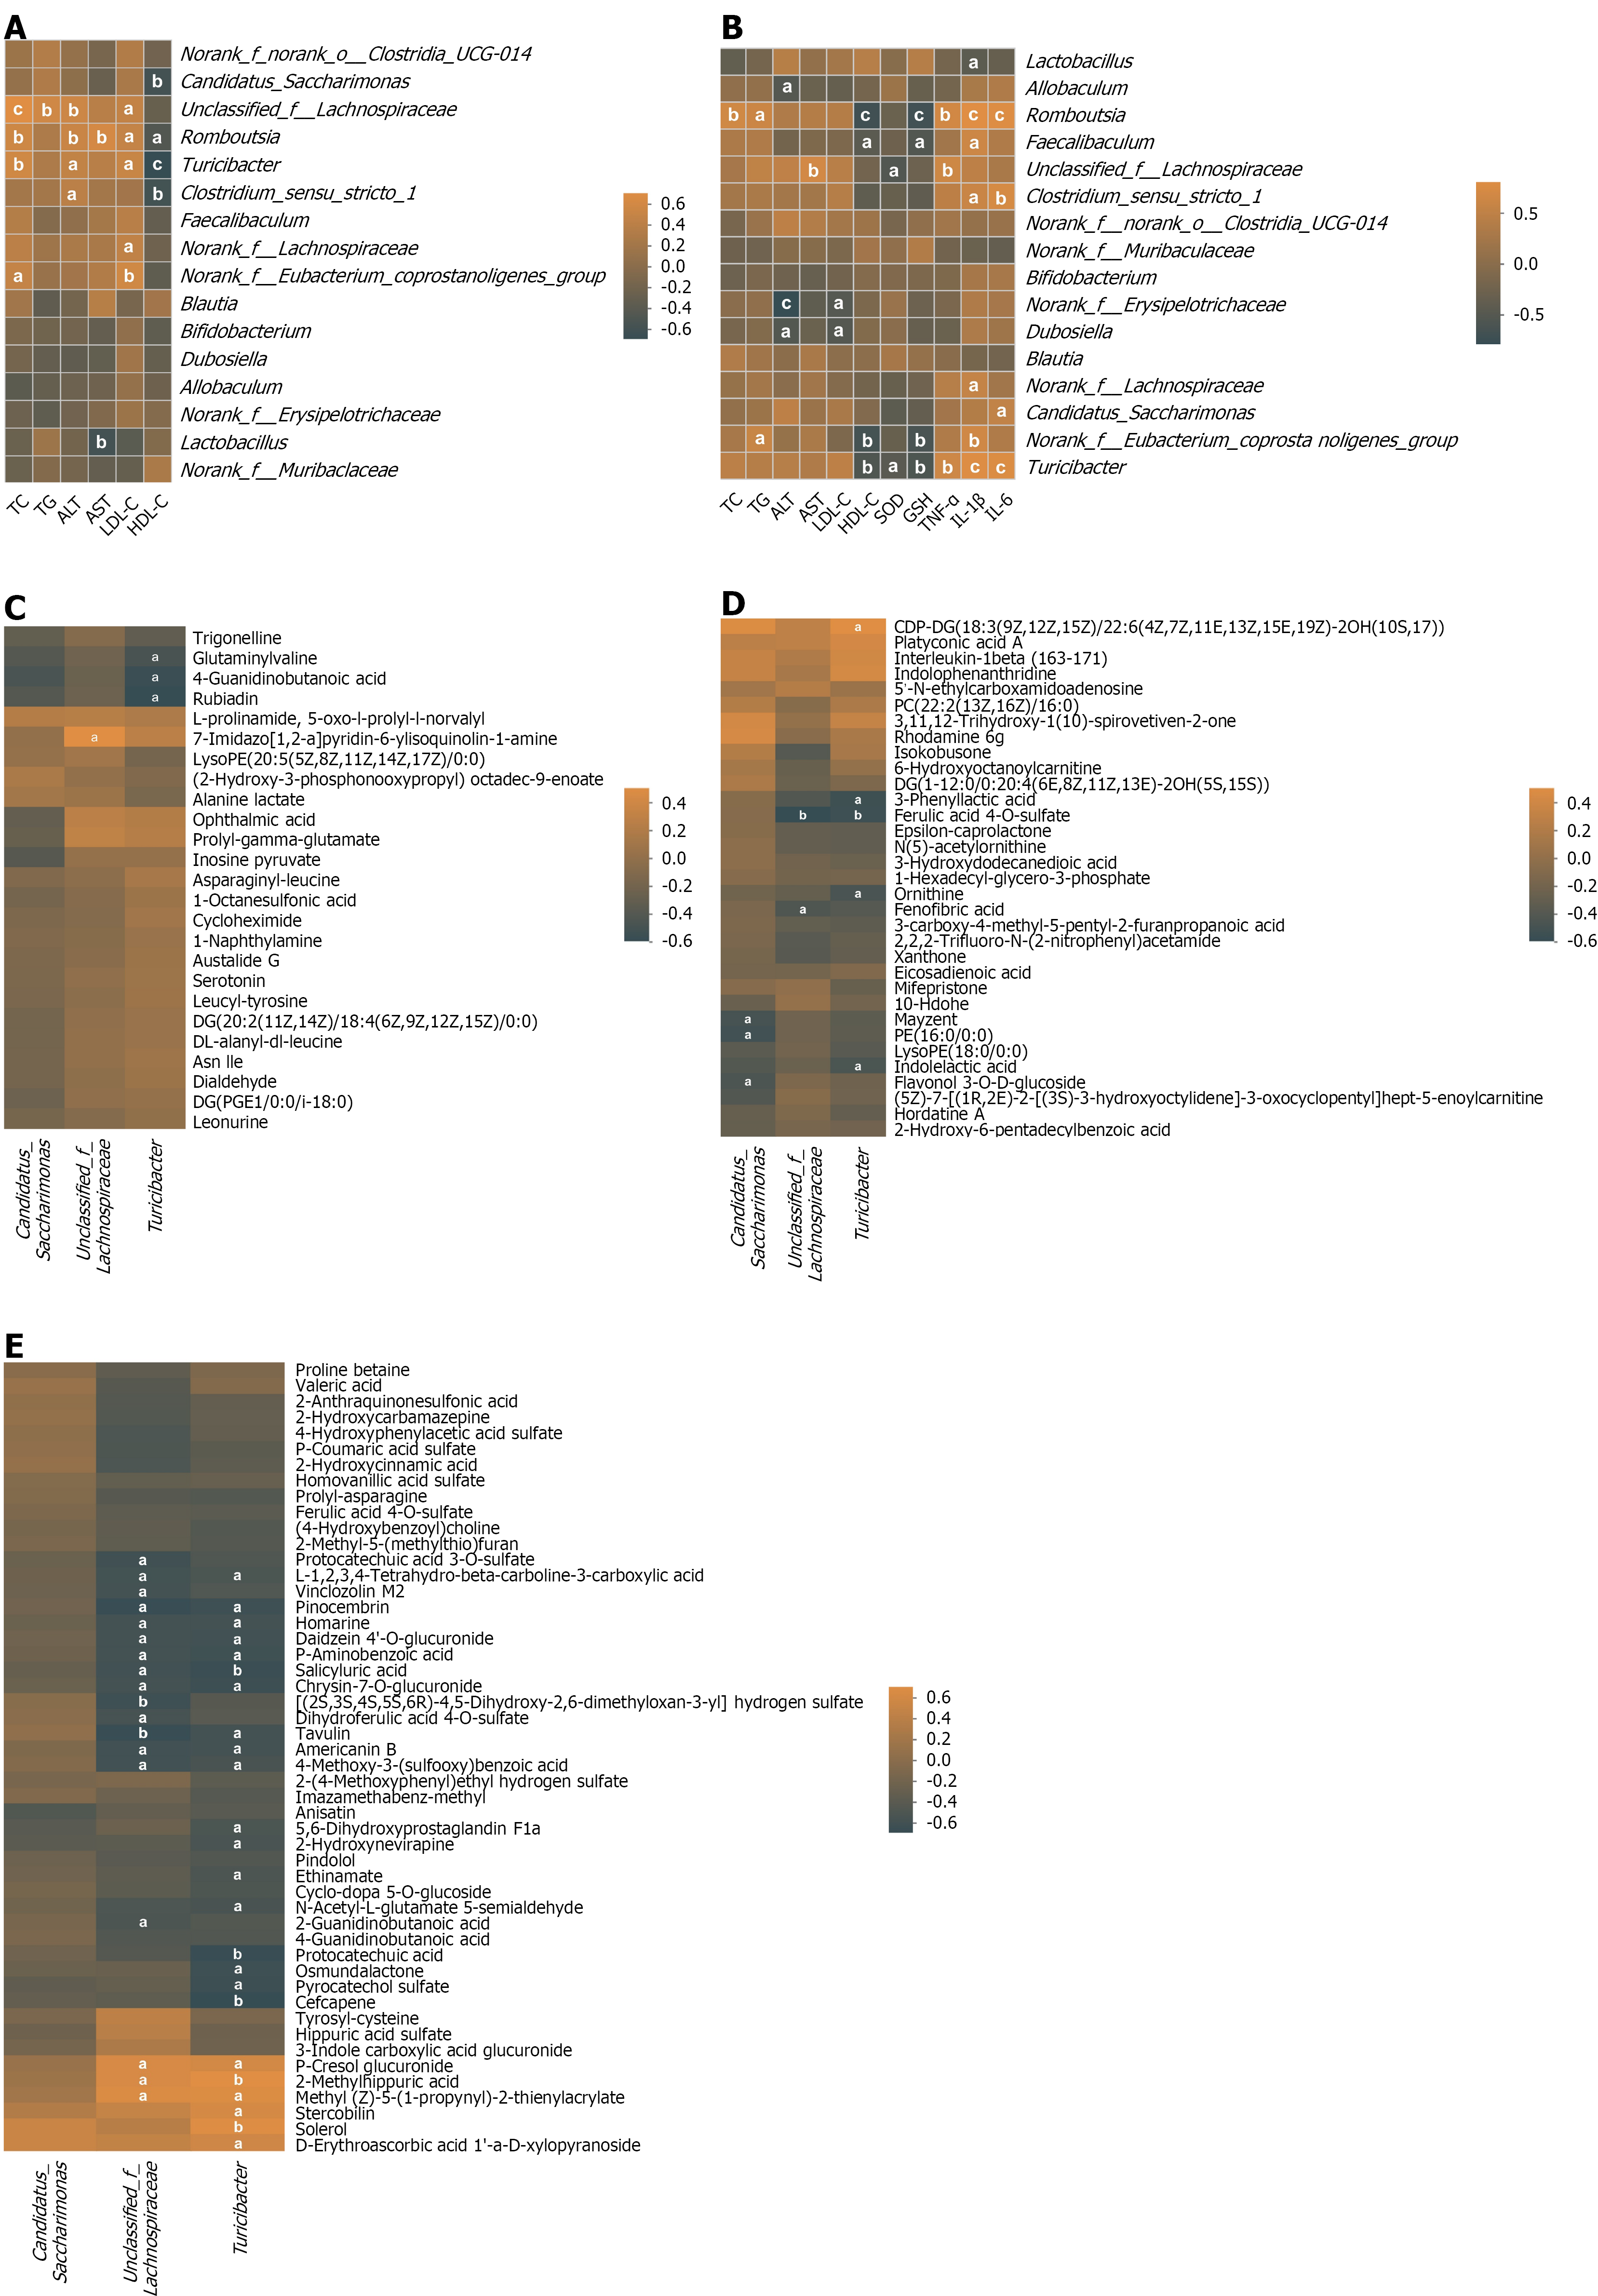
Figure 5 Spearman’s correlation analysis among gut microbiota, pathological indicators, and differential metabolites regulated by Fuling Zexie decoction.
Spearman’s correlation heatmap between gut microbiota at the genus level and serum pathological indicators (A), liver pathological indicators (B), serum differential metabolites (C), liver differential metabolites (D), and urine differential metabolites (E). aP < 0.05. bP < 0.01. cP < 0.001. TC: Total cholesterol; TG: Triglyceride; ALT: Alanine aminotransferase; AST: Aspartate aminotransferase; LDL-C: Low-density lipoprotein cholesterol; HDL-C: High-density lipoprotein cholesterol; SOD: Superoxide dismutase; GSH: Glutathione; TNF: Tumor necrosis factor; IL: Interleukin.
- Citation: Wang PQ, Yang H, Tang YM, Tao YX, Han SC, Zhou QD, Yu J, Yang XX. Mechanisms of Fuling Zexie decoction against metabolic dysfunction-associated steatotic liver disease: Integrative metabolomics, gut microbiota and serum pharmacochemistry. World J Gastroenterol 2027; 33(1): 123034
- URL: https://www.wjgnet.com/1007-9327/full/v33/i1/123034.htm
- DOI: https://dx.doi.org/10.3748/wjg.123034