
















Copyright: ©Author(s) 2027.
World J Gastroenterol. Jan 7, 2027; 33(1): 122971
Published online Jan 7, 2027. doi: 10.3748/wjg.122971
Published online Jan 7, 2027. doi: 10.3748/wjg.122971
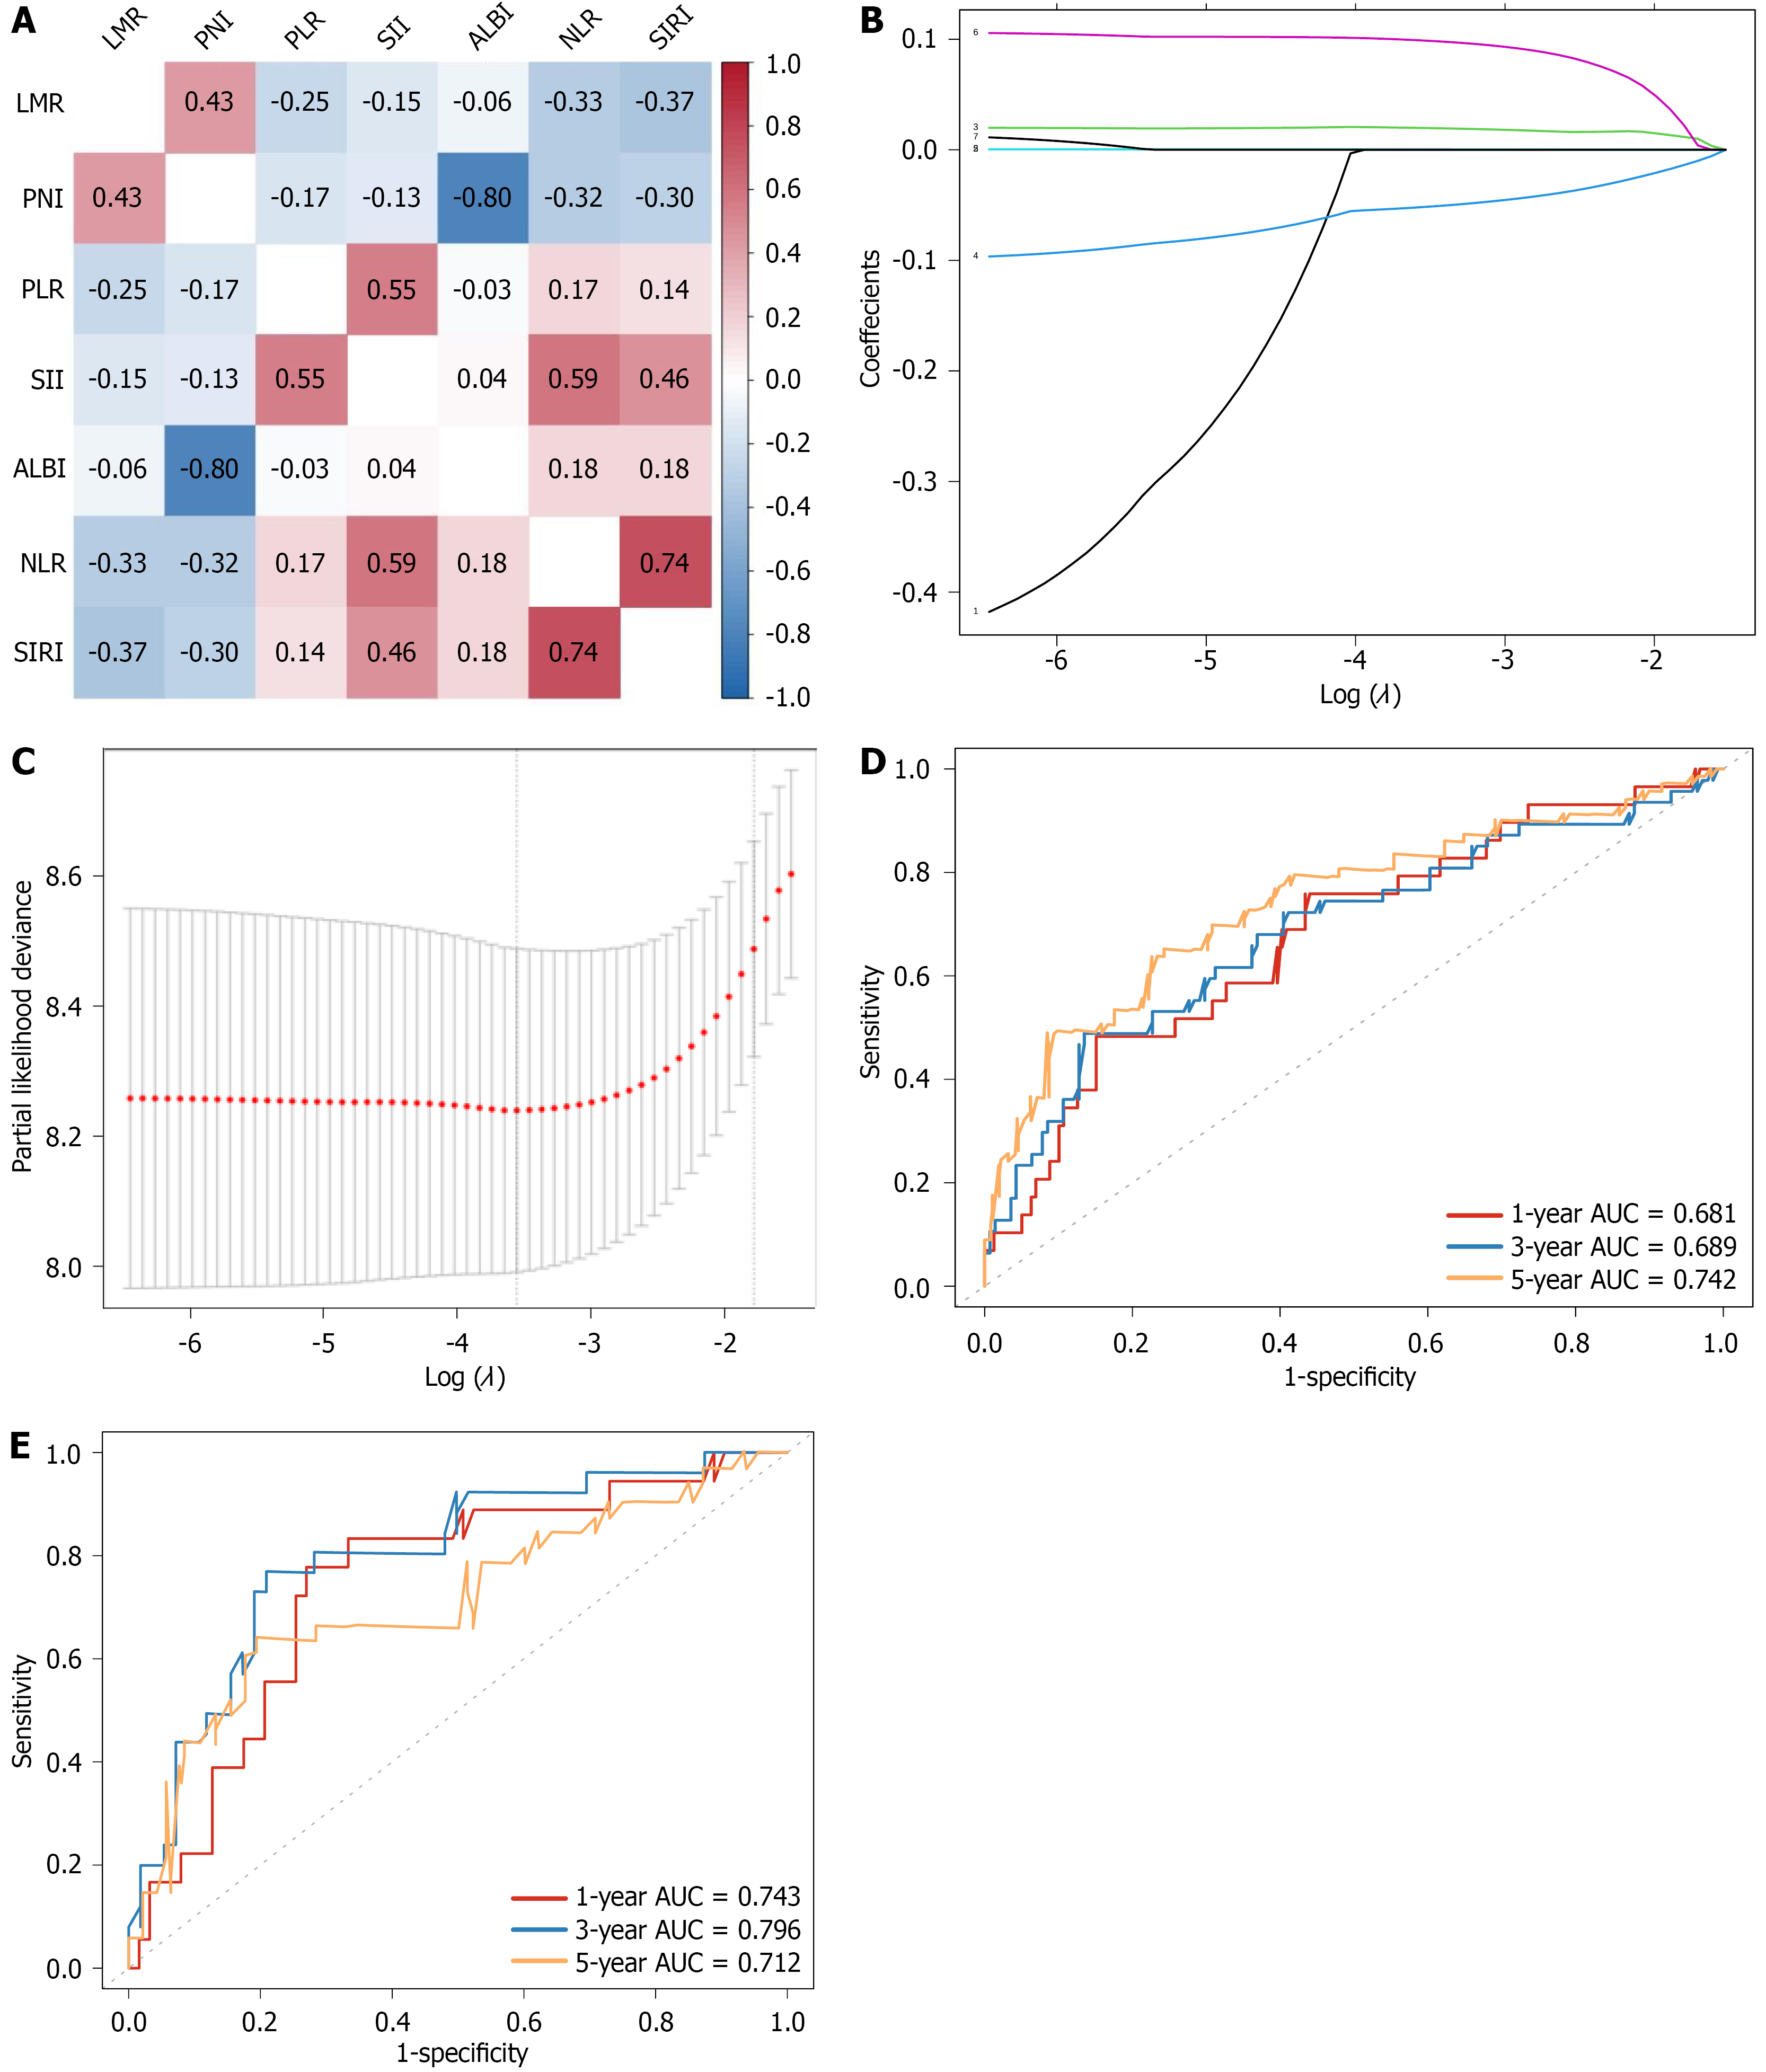
Figure 3 Development of the prognostic immune-inflammatory-nutritional score using a least absolute shrinkage and selection operator regression model.
A: Heatmap of pairwise connections across indicators related to immunity, inflammation, and nutrition; B: Coefficient path plot for seven candidate variables in least absolute shrinkage and selection operator regression; C: Cross-validation curve of least absolute shrinkage and selection operator regression; D: Receiver characteristic curves of prognostic immune-inflammatory-nutritional score in predicting postoperative 1-year, 3-year, and 5-year overall survival in the training set; E: Receiver characteristic curves of prognostic immune-inflammatory-nutritional score in predicting postoperative 1-year, 3-year, and 5-year overall survival in the validation sets. LMR: Lymphocyte-to-monocyte ratio; PNI: Prognostic nutritional index; PLR: Platelet-to-lymphocyte ratio; SII: Systemic immune-inflammation index; ALBI: Albumin-bilirubin index; NLR: Neutrophil-to-lymphocyte ratio; SIRI: Systemic inflammation response index; AUC: Area under the receiver characteristic curve.
- Citation: Huang JC, Wang HX, Zhao Y, Li XL, He Q, Lang R, Zhou L. Nomogram integrating prognostic immune-inflammatory-nutritional score with clinicopathological parameters for predicting post-transplantation outcomes in hepatocellular carcinoma. World J Gastroenterol 2027; 33(1): 122971
- URL: https://www.wjgnet.com/1007-9327/full/v33/i1/122971.htm
- DOI: https://dx.doi.org/10.3748/wjg.122971