
















©Author(s) (or their employer(s)) 2026.
World J Gastroenterol. Mar 7, 2026; 32(9): 114200
Published online Mar 7, 2026. doi: 10.3748/wjg.v32.i9.114200
Published online Mar 7, 2026. doi: 10.3748/wjg.v32.i9.114200
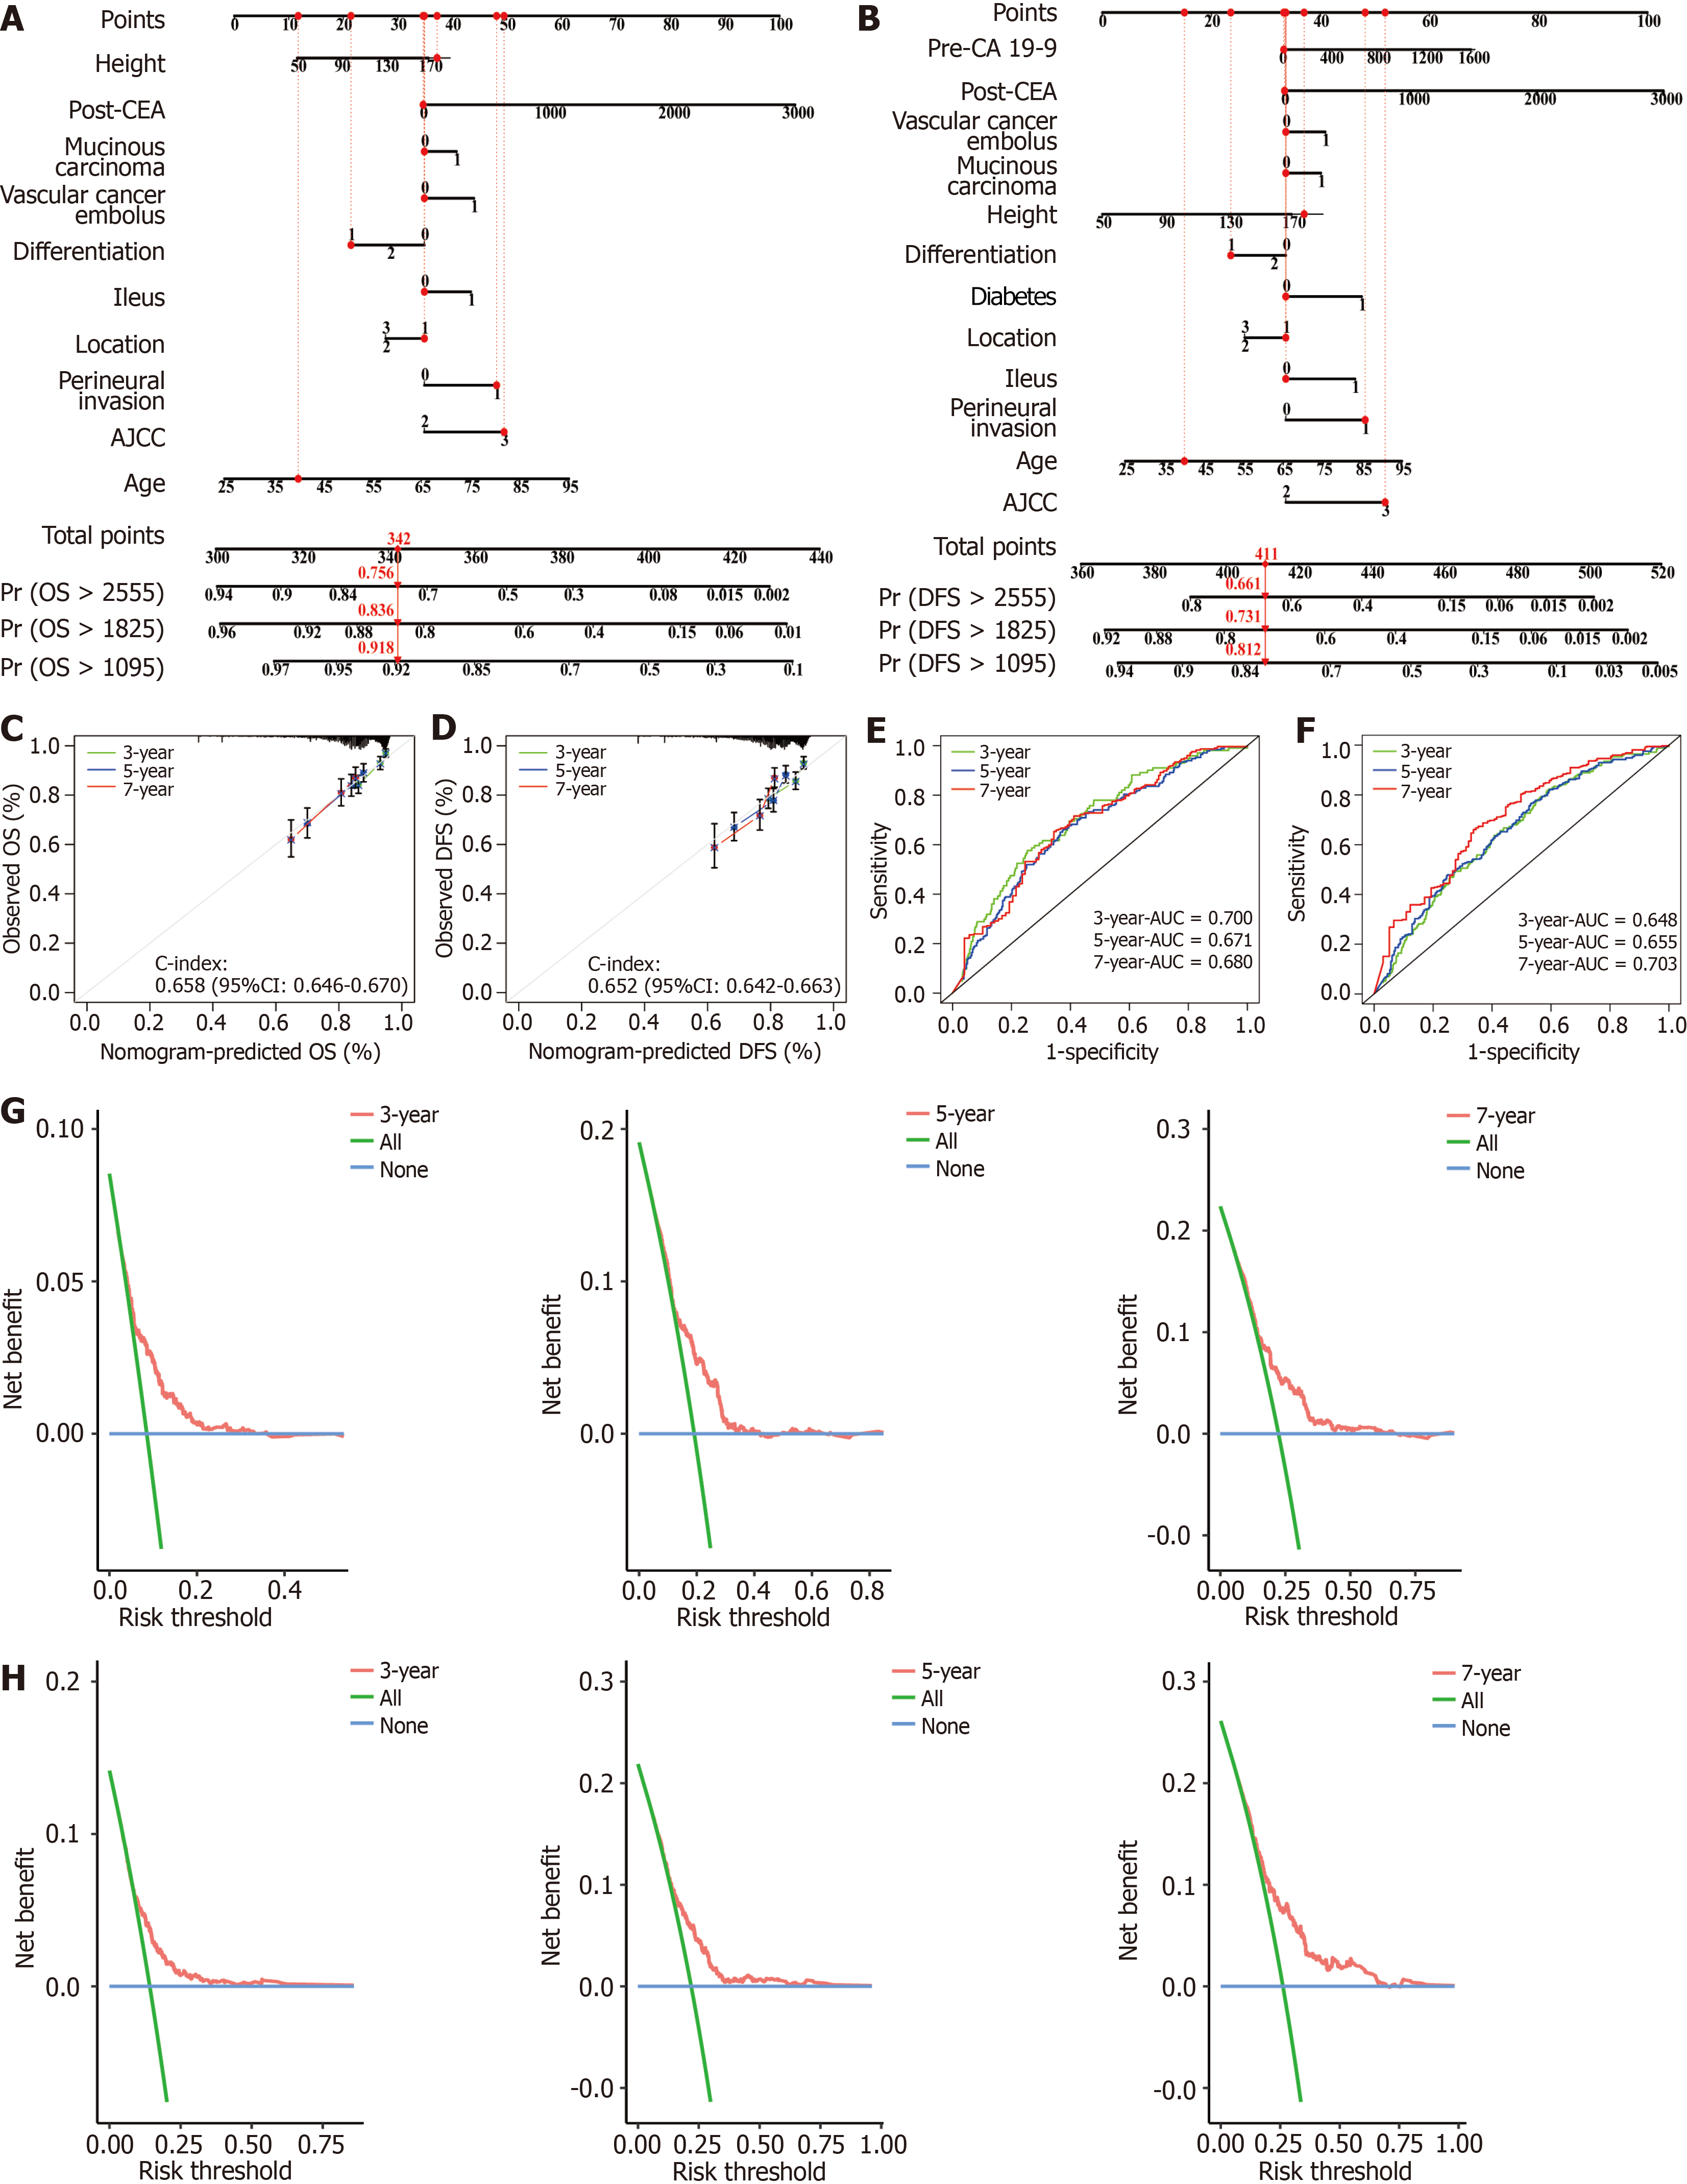
Figure 4 The performance of the nomograms in the validation cohort.
A and B: Nomograms of overall survival (OS) and disease-free survival (DFS) based on the training cohort; C: Calibration curves for the nomogram of OS at 3, 5, 7 years in the validation cohort; D: Calibration curves for the nomogram of DFS at 3, 5, 7 years in the validation cohort; E: Receiver operating characteristic (ROC) curves for the nomogram of OS at 3, 5, 7 years in the validation cohort; F: ROC curves for the nomogram of DFS at 3, 5, 7 years in the validation cohort; G and H: Decision curve analyses (DCA) for the nomograms of OS (G) and DFS (H) at 3, 5, 7 years in the validation cohort. OS: Overall survival; DFS: Disease-free survival; AUC: Area under the curve; post-CEA: Postoperative carcinoembryonic antigen; AJCC: American Joint Committee on Cancer; CI: Confidence interval.
- Citation: Du FQ, Liu JL, Mai LD, Han XH, Song WJ, Yang D, Zhang QJ, Zhang R, Liu YL, Tong JX. Perioperative serum carcinoembryonic antigen: Powerful marker for prognostic prediction and adjuvant chemotherapy decision-making in patients with stage II and III colorectal cancer. World J Gastroenterol 2026; 32(9): 114200
- URL: https://www.wjgnet.com/1007-9327/full/v32/i9/114200.htm
- DOI: https://dx.doi.org/10.3748/wjg.v32.i9.114200