
















©The Author(s) 2026.
World J Gastroenterol. Feb 28, 2026; 32(8): 115333
Published online Feb 28, 2026. doi: 10.3748/wjg.v32.i8.115333
Published online Feb 28, 2026. doi: 10.3748/wjg.v32.i8.115333
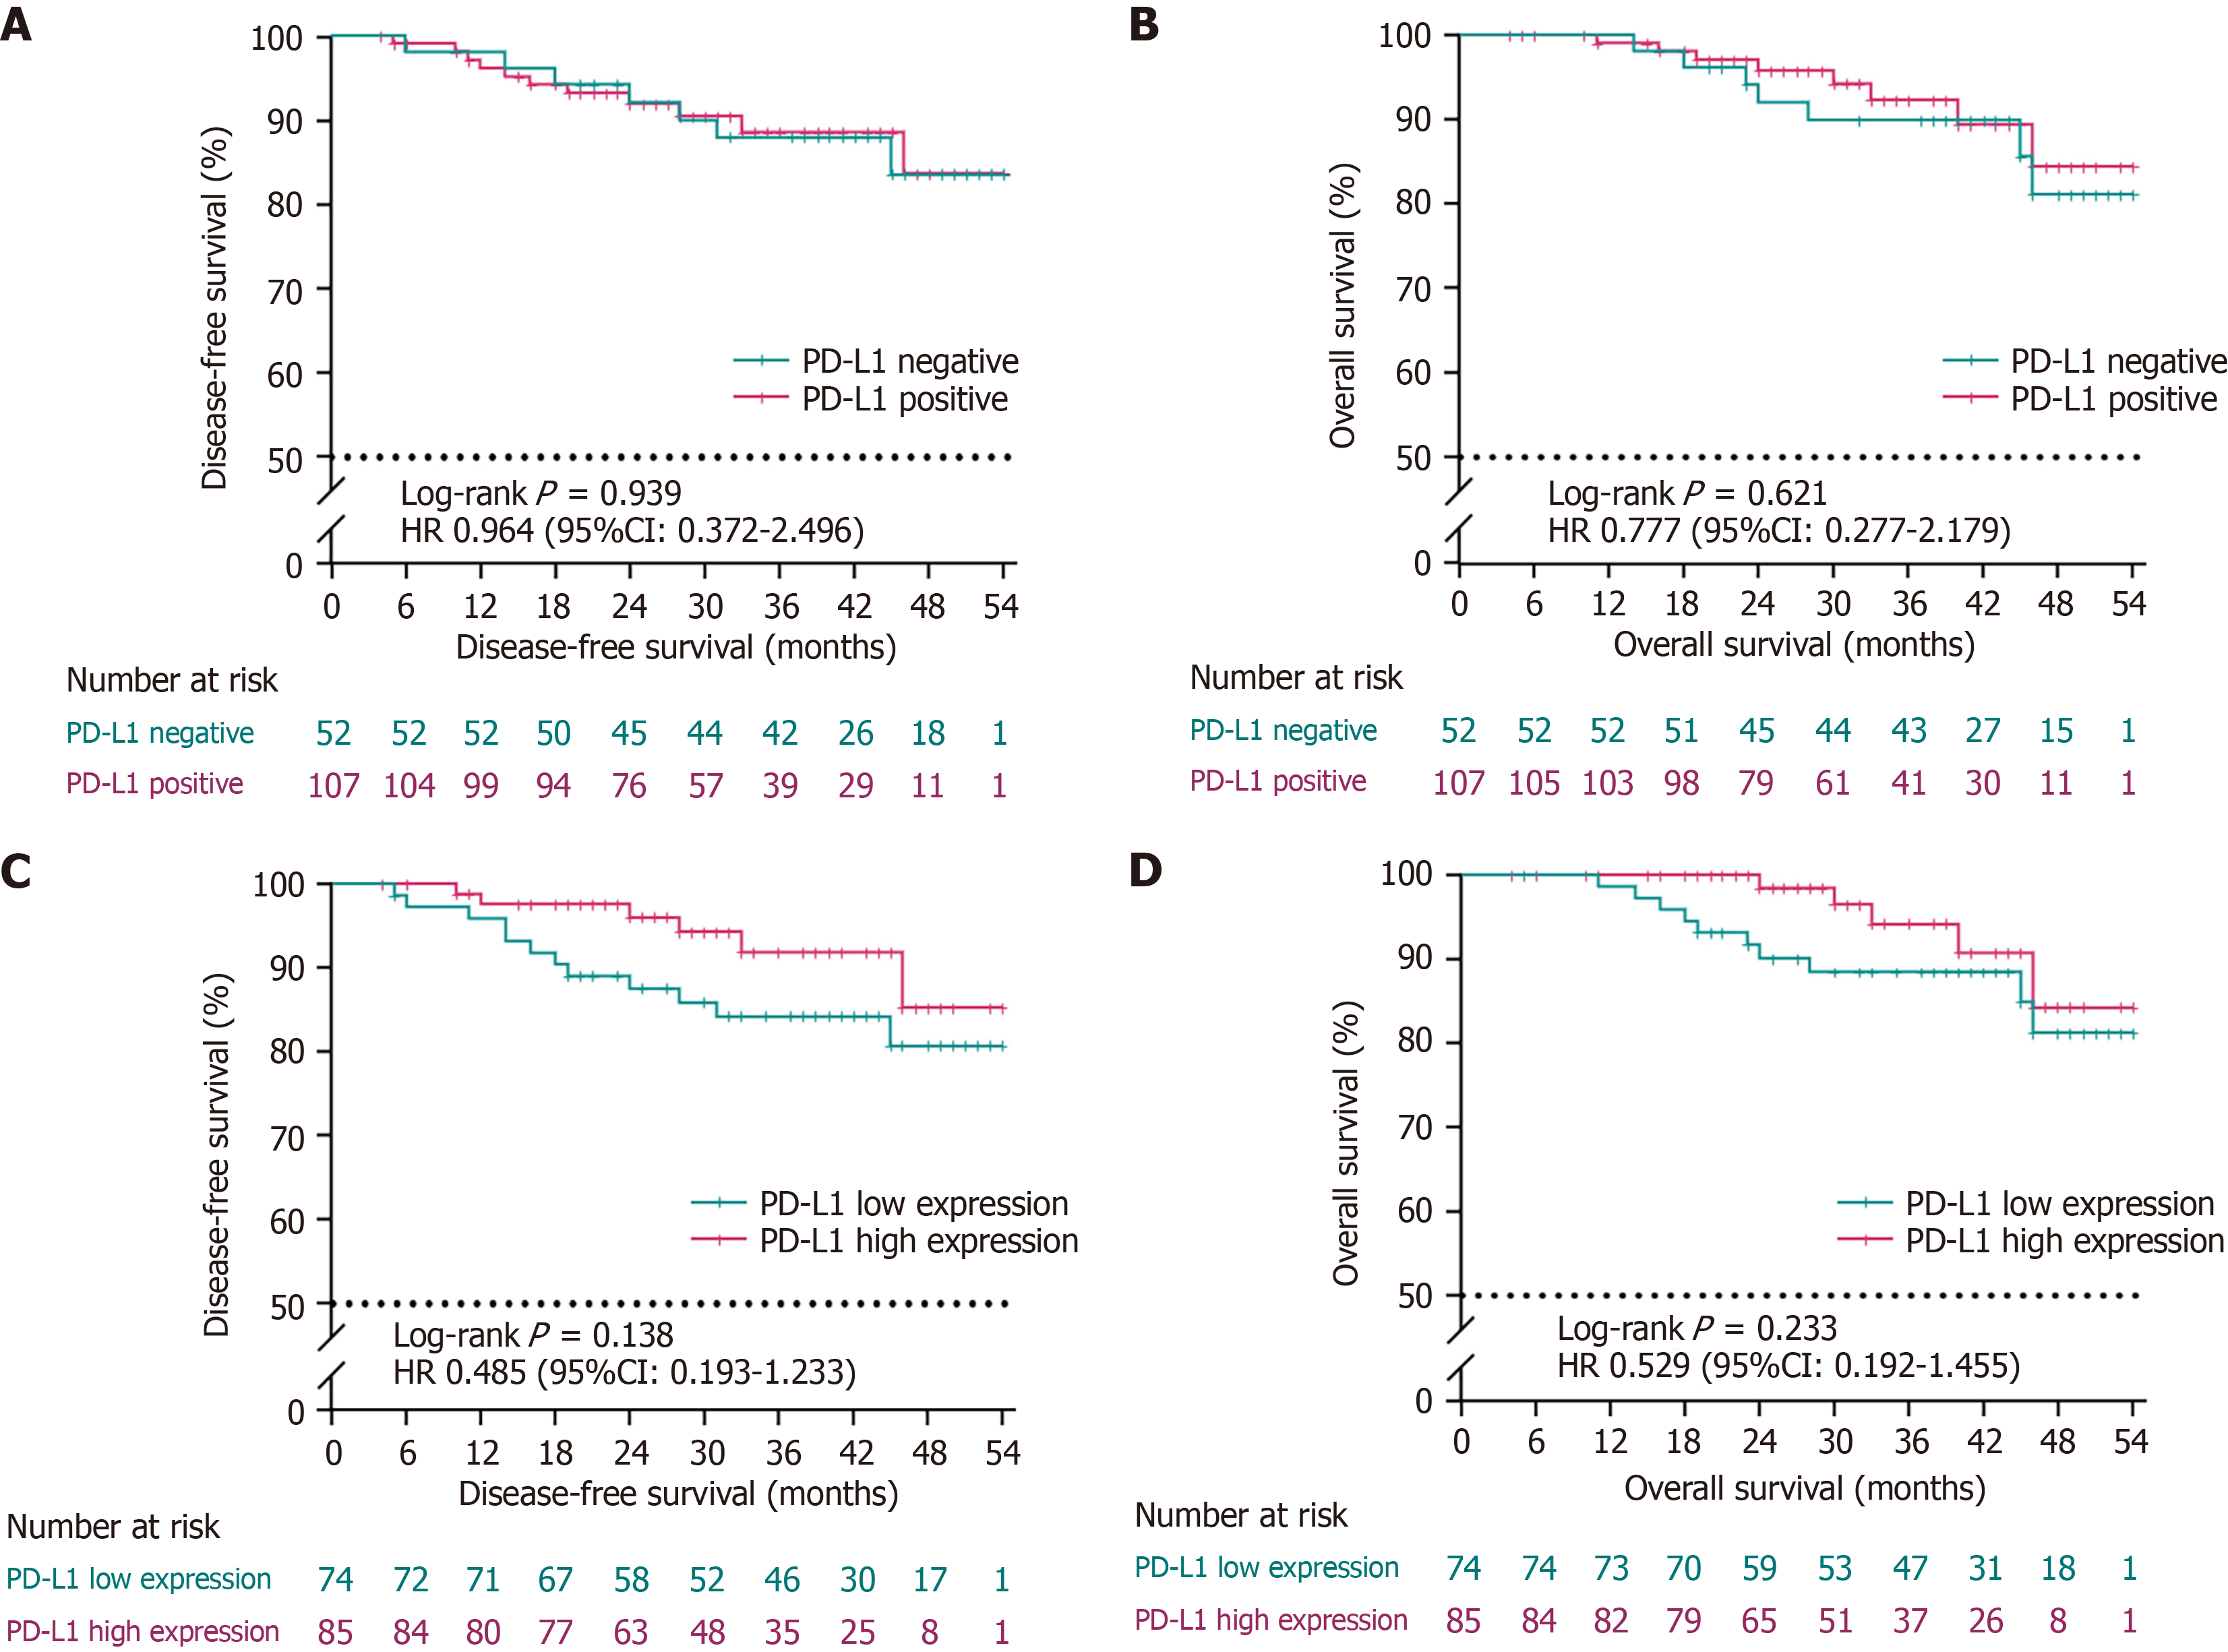
Figure 3 Survival outcomes according to programmed death ligand-1 expression in patients with pathological stage II gastric or gastroesophageal junction cancer.
A and B: Kaplan-Meier curves showing disease-free survival (DFS) and overall survival (OS) between programmed death ligand-1 (PD-L1)-positive and PD-L1-negative groups; C and D: Kaplan-Meier curves showing DFS and OS between high and low PD-L1 expression groups. No significant differences in DFS or OS were observed between the groups. PD-L1: Programmed death ligand-1.
- Citation: Zhang HM, Li FP, Zhang HY, Liu XR, Chen XH, Liang HY, Yan X, Xie Q, Zhong R, Lai M, Zhong XF, Liu H, Zhao LY. High PD-L1 expression as a negative prognostic factor in stage III but not in stage II gastric cancer. World J Gastroenterol 2026; 32(8): 115333
- URL: https://www.wjgnet.com/1007-9327/full/v32/i8/115333.htm
- DOI: https://dx.doi.org/10.3748/wjg.v32.i8.115333