
















©The Author(s) 2026.
World J Gastroenterol. Feb 21, 2026; 32(7): 113973
Published online Feb 21, 2026. doi: 10.3748/wjg.v32.i7.113973
Published online Feb 21, 2026. doi: 10.3748/wjg.v32.i7.113973
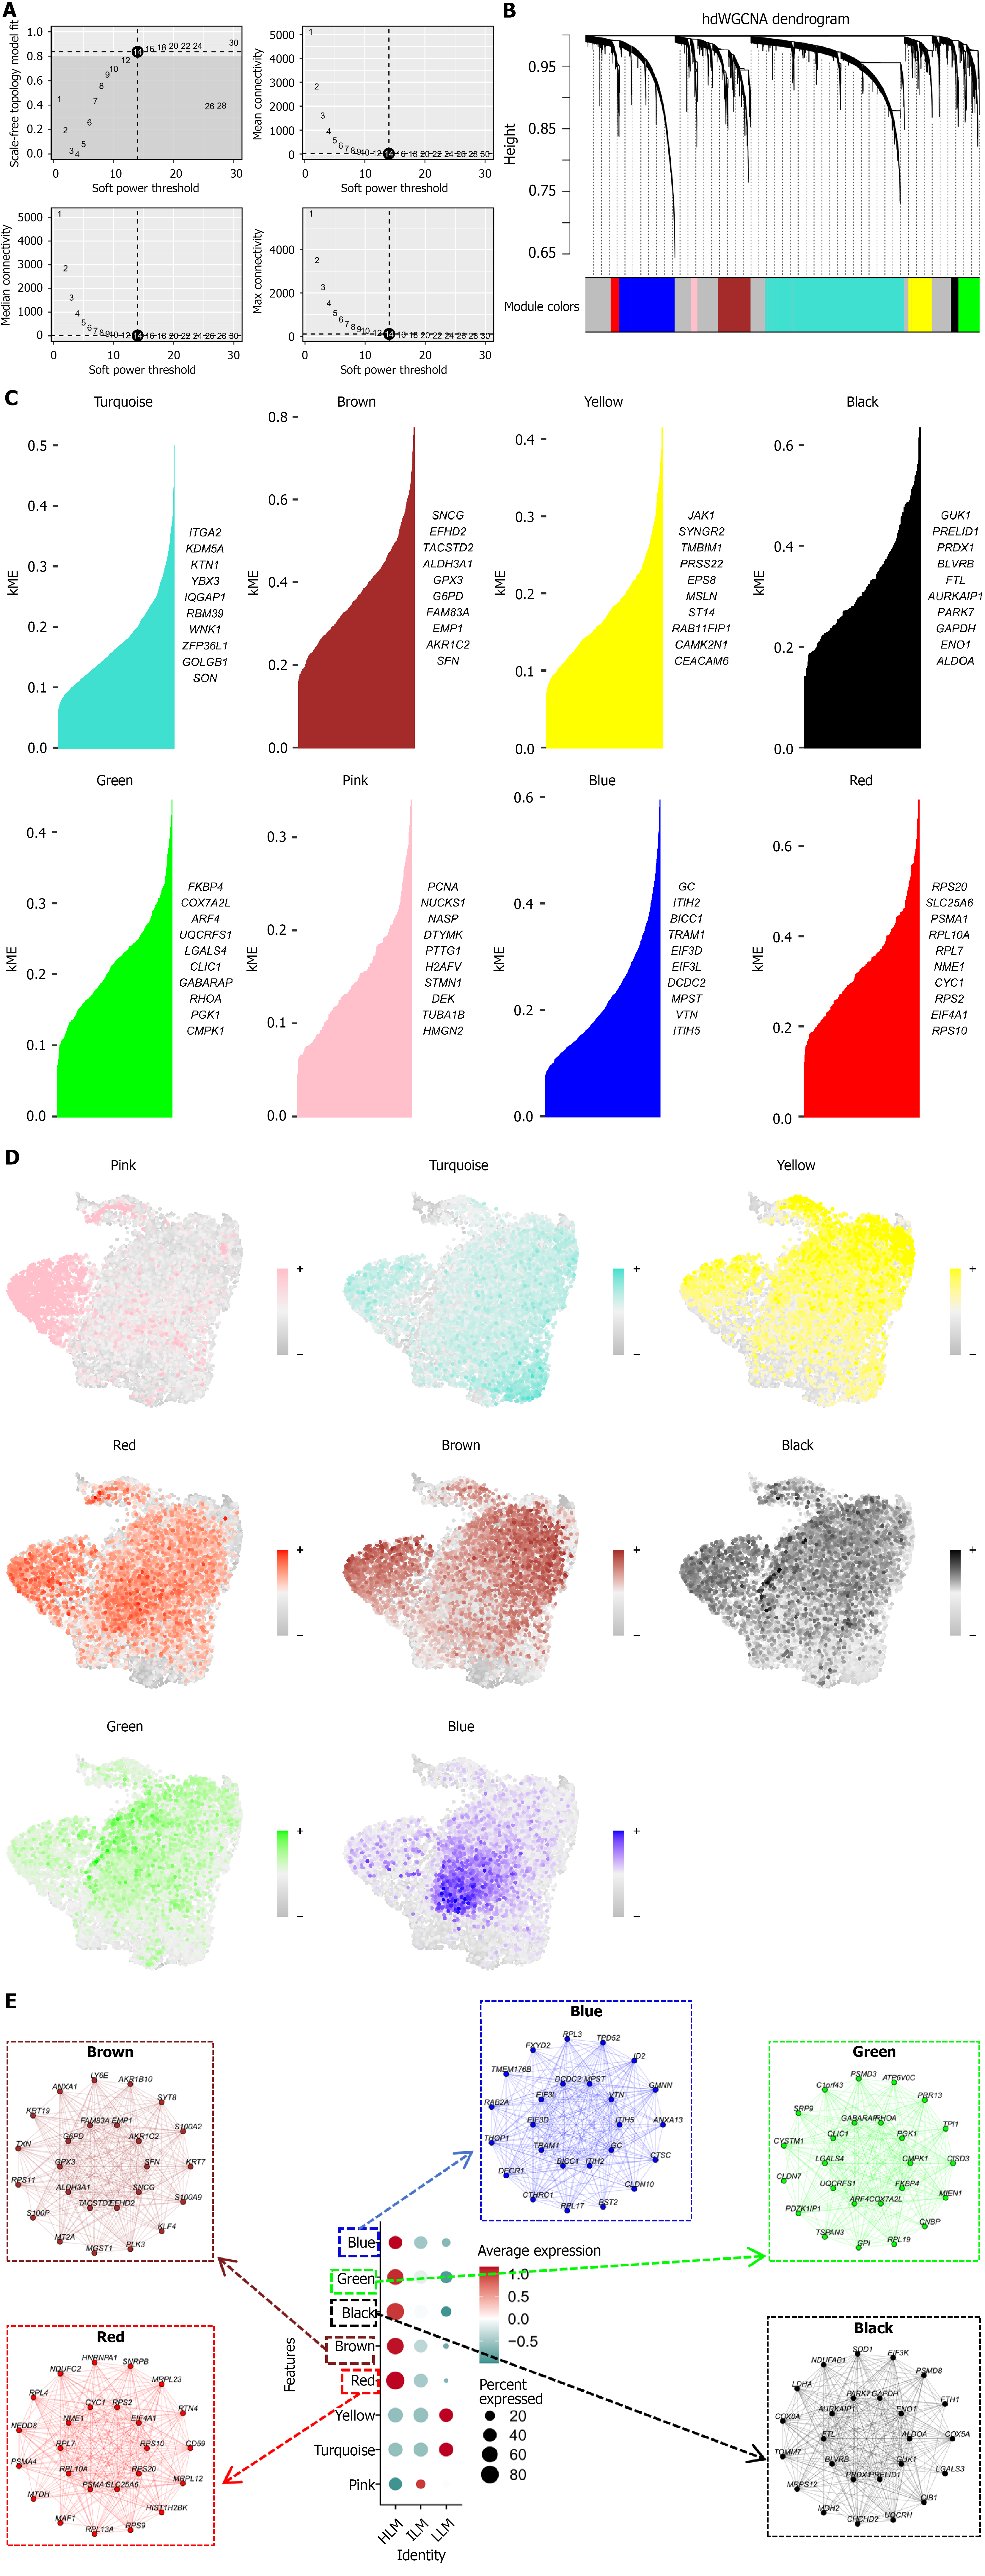
Figure 5 Identification of lactate metabolism-associated gene co-expression modules in malignant intrahepatic cholangiocarcinoma cells.
A: Determination of soft-thresholding power (β = 14) achieving scale-free topology fit ≥ 0.8; B: Gene dendrogram and module color assignment by high-dimensional weighted gene co-expression network analysis; C: Module eigengene correlations and top hub genes per module; D: Uniform manifold approximation and projection visualization of module-specific gene expression across malignant cells; E: Module-trait relationship plot showing relative enrichment of modules across lactate metabolism activity subgroups. hdWGCNA: High-dimensional weighted gene co-expression network analysis; kME: Eigengene connectivity; LLM: Low-lactate metabolism; ILM: Intermediate-lactate metabolism; HLM: High-lactate metabolism.
- Citation: Wu AK, Li JY, Zhang K, Meng M, Wang X, Liu Y, Xie P, Rong WQ, Wu F, Wang HG, Meng X, Wu JX. Lactate metabolism-driven tumor heterogeneity and molecular signatures in intrahepatic cholangiocarcinoma. World J Gastroenterol 2026; 32(7): 113973
- URL: https://www.wjgnet.com/1007-9327/full/v32/i7/113973.htm
- DOI: https://dx.doi.org/10.3748/wjg.v32.i7.113973