
















©The Author(s) 2026.
World J Gastroenterol. Feb 21, 2026; 32(7): 113973
Published online Feb 21, 2026. doi: 10.3748/wjg.v32.i7.113973
Published online Feb 21, 2026. doi: 10.3748/wjg.v32.i7.113973
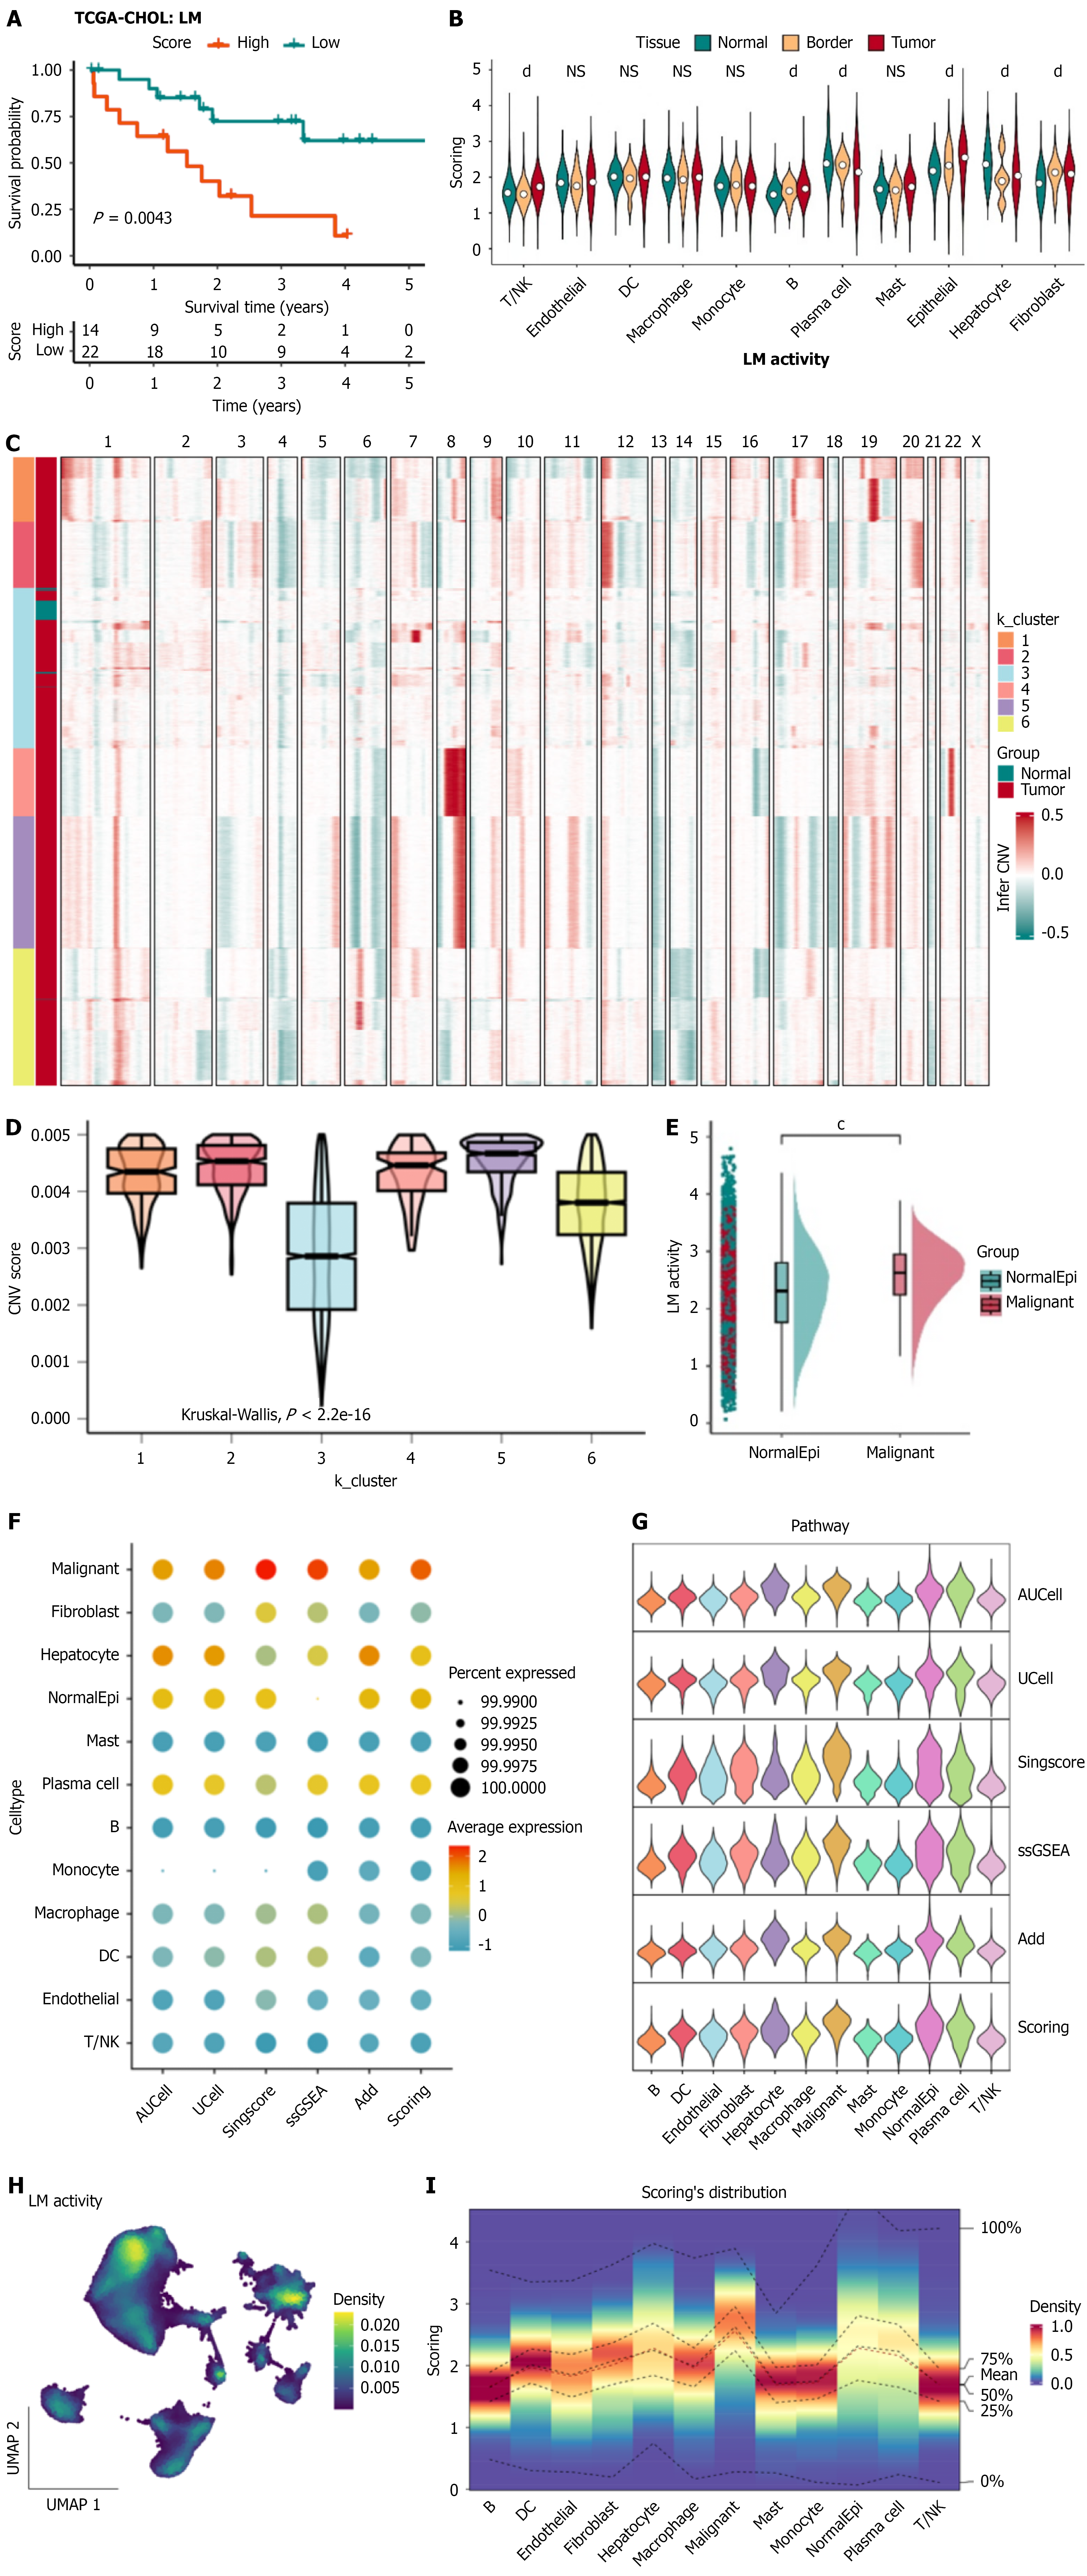
Figure 2 Evaluation of lactate metabolism activity in intrahepatic cholangiocarcinoma.
A: Kaplan-Meier analysis of the Cancer Genome Atlas-cholangiocarcinoma cohort showing that patients with high lactate metabolism (LM) activity exhibited significantly reduced overall survival compared to the low LM group (P = 0.0043); B: Violin plots comparing LM activity across major cell types within the intrahepatic cholangiocarcinoma (ICC) microenvironment; C: Heatmap of infer copy number variation (CNV) analysis identifying six epithelial clusters based on chromosomal CNV profiles; D: Boxplots illustrating significantly higher CNV scores in malignant clusters (K1, K2, K4, K5, and K6) compared with non-malignant cluster K3 (P < 0.001); E: Comparison of LM activity between normal and malignant epithelial cells, showing markedly elevated LM activity in the malignant population (P < 0.001); F and G: LM activity quantified by five computational algorithms (AUCell, UCell, singscore, single-sample Gene Set Enrichment Analysis, and AddModuleScore), consistently indicating higher LM activity in malignant epithelial cells; H: Uniform manifold approximation and projection visualization displaying the spatial distribution of LM activity scores across the ICC microen
- Citation: Wu AK, Li JY, Zhang K, Meng M, Wang X, Liu Y, Xie P, Rong WQ, Wu F, Wang HG, Meng X, Wu JX. Lactate metabolism-driven tumor heterogeneity and molecular signatures in intrahepatic cholangiocarcinoma. World J Gastroenterol 2026; 32(7): 113973
- URL: https://www.wjgnet.com/1007-9327/full/v32/i7/113973.htm
- DOI: https://dx.doi.org/10.3748/wjg.v32.i7.113973