
















©The Author(s) 2026.
World J Gastroenterol. Feb 14, 2026; 32(6): 113195
Published online Feb 14, 2026. doi: 10.3748/wjg.v32.i6.113195
Published online Feb 14, 2026. doi: 10.3748/wjg.v32.i6.113195
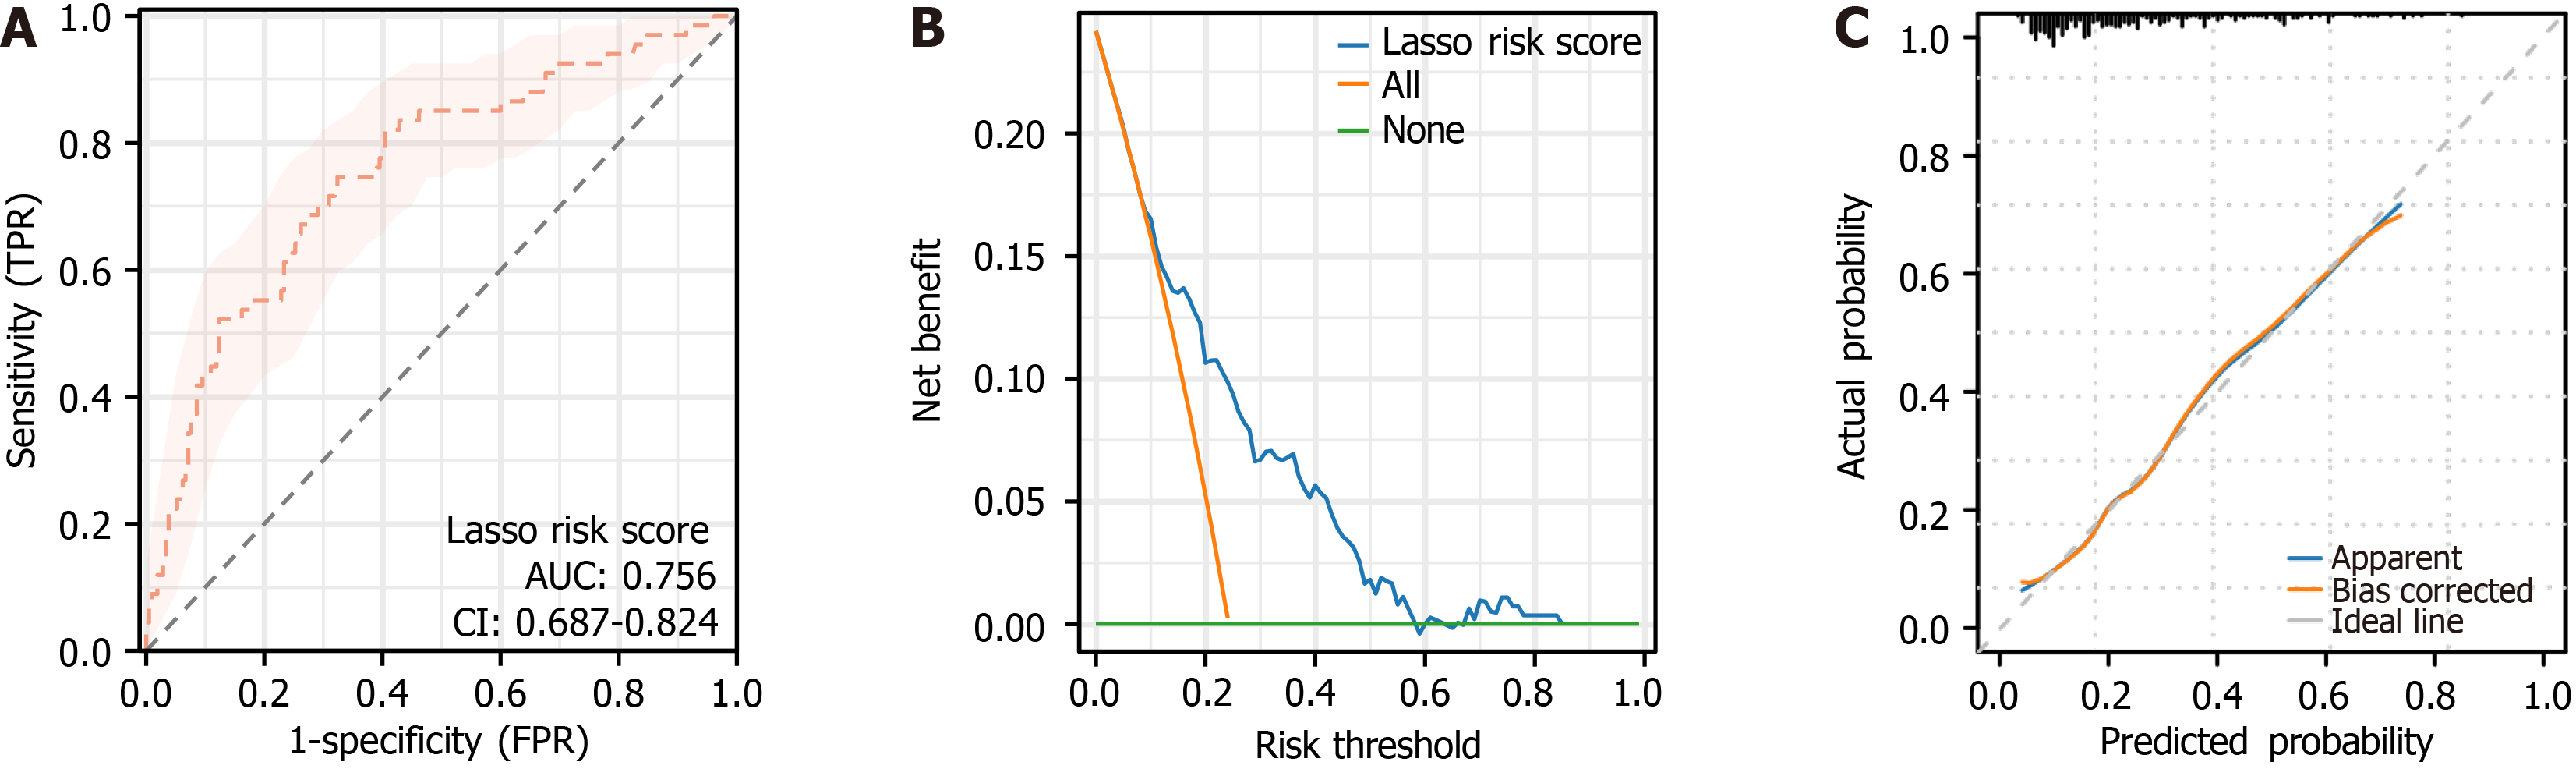
Figure 4 Receiver operating characteristic curve, decision curve, and calibration curve validation of the least absolute shrinkage and selection operator model (training group).
A: The receiver operating characteristic curve demonstrates the model’s good discriminatory power (area under the curve = 0.756) in the training group; B: Decision curve analysis evaluation of the model’s clinical net benefit showed a maximum net benefit of 24.18% within the 0%-84% threshold range; C: The calibration curve shows a good fit and calibration between model predictions and the actual occurrence rate. The χ2 value of the goodness of fit test is 5.5714, and the P value is 0.6951. TPR: True positive rate; FPR: False positive rate; AUC: Area under the curve; CI: Confidence interval.
- Citation: Feng W, Ye QW, Wang QL, Chen SY, Ma Y, Meng FL. Predictors of one-year adverse outcomes after laparoscopic resection for hepatocellular carcinoma: Development and validation of an early-warning model. World J Gastroenterol 2026; 32(6): 113195
- URL: https://www.wjgnet.com/1007-9327/full/v32/i6/113195.htm
- DOI: https://dx.doi.org/10.3748/wjg.v32.i6.113195