
















©The Author(s) 2026.
World J Gastroenterol. Feb 14, 2026; 32(6): 113195
Published online Feb 14, 2026. doi: 10.3748/wjg.v32.i6.113195
Published online Feb 14, 2026. doi: 10.3748/wjg.v32.i6.113195
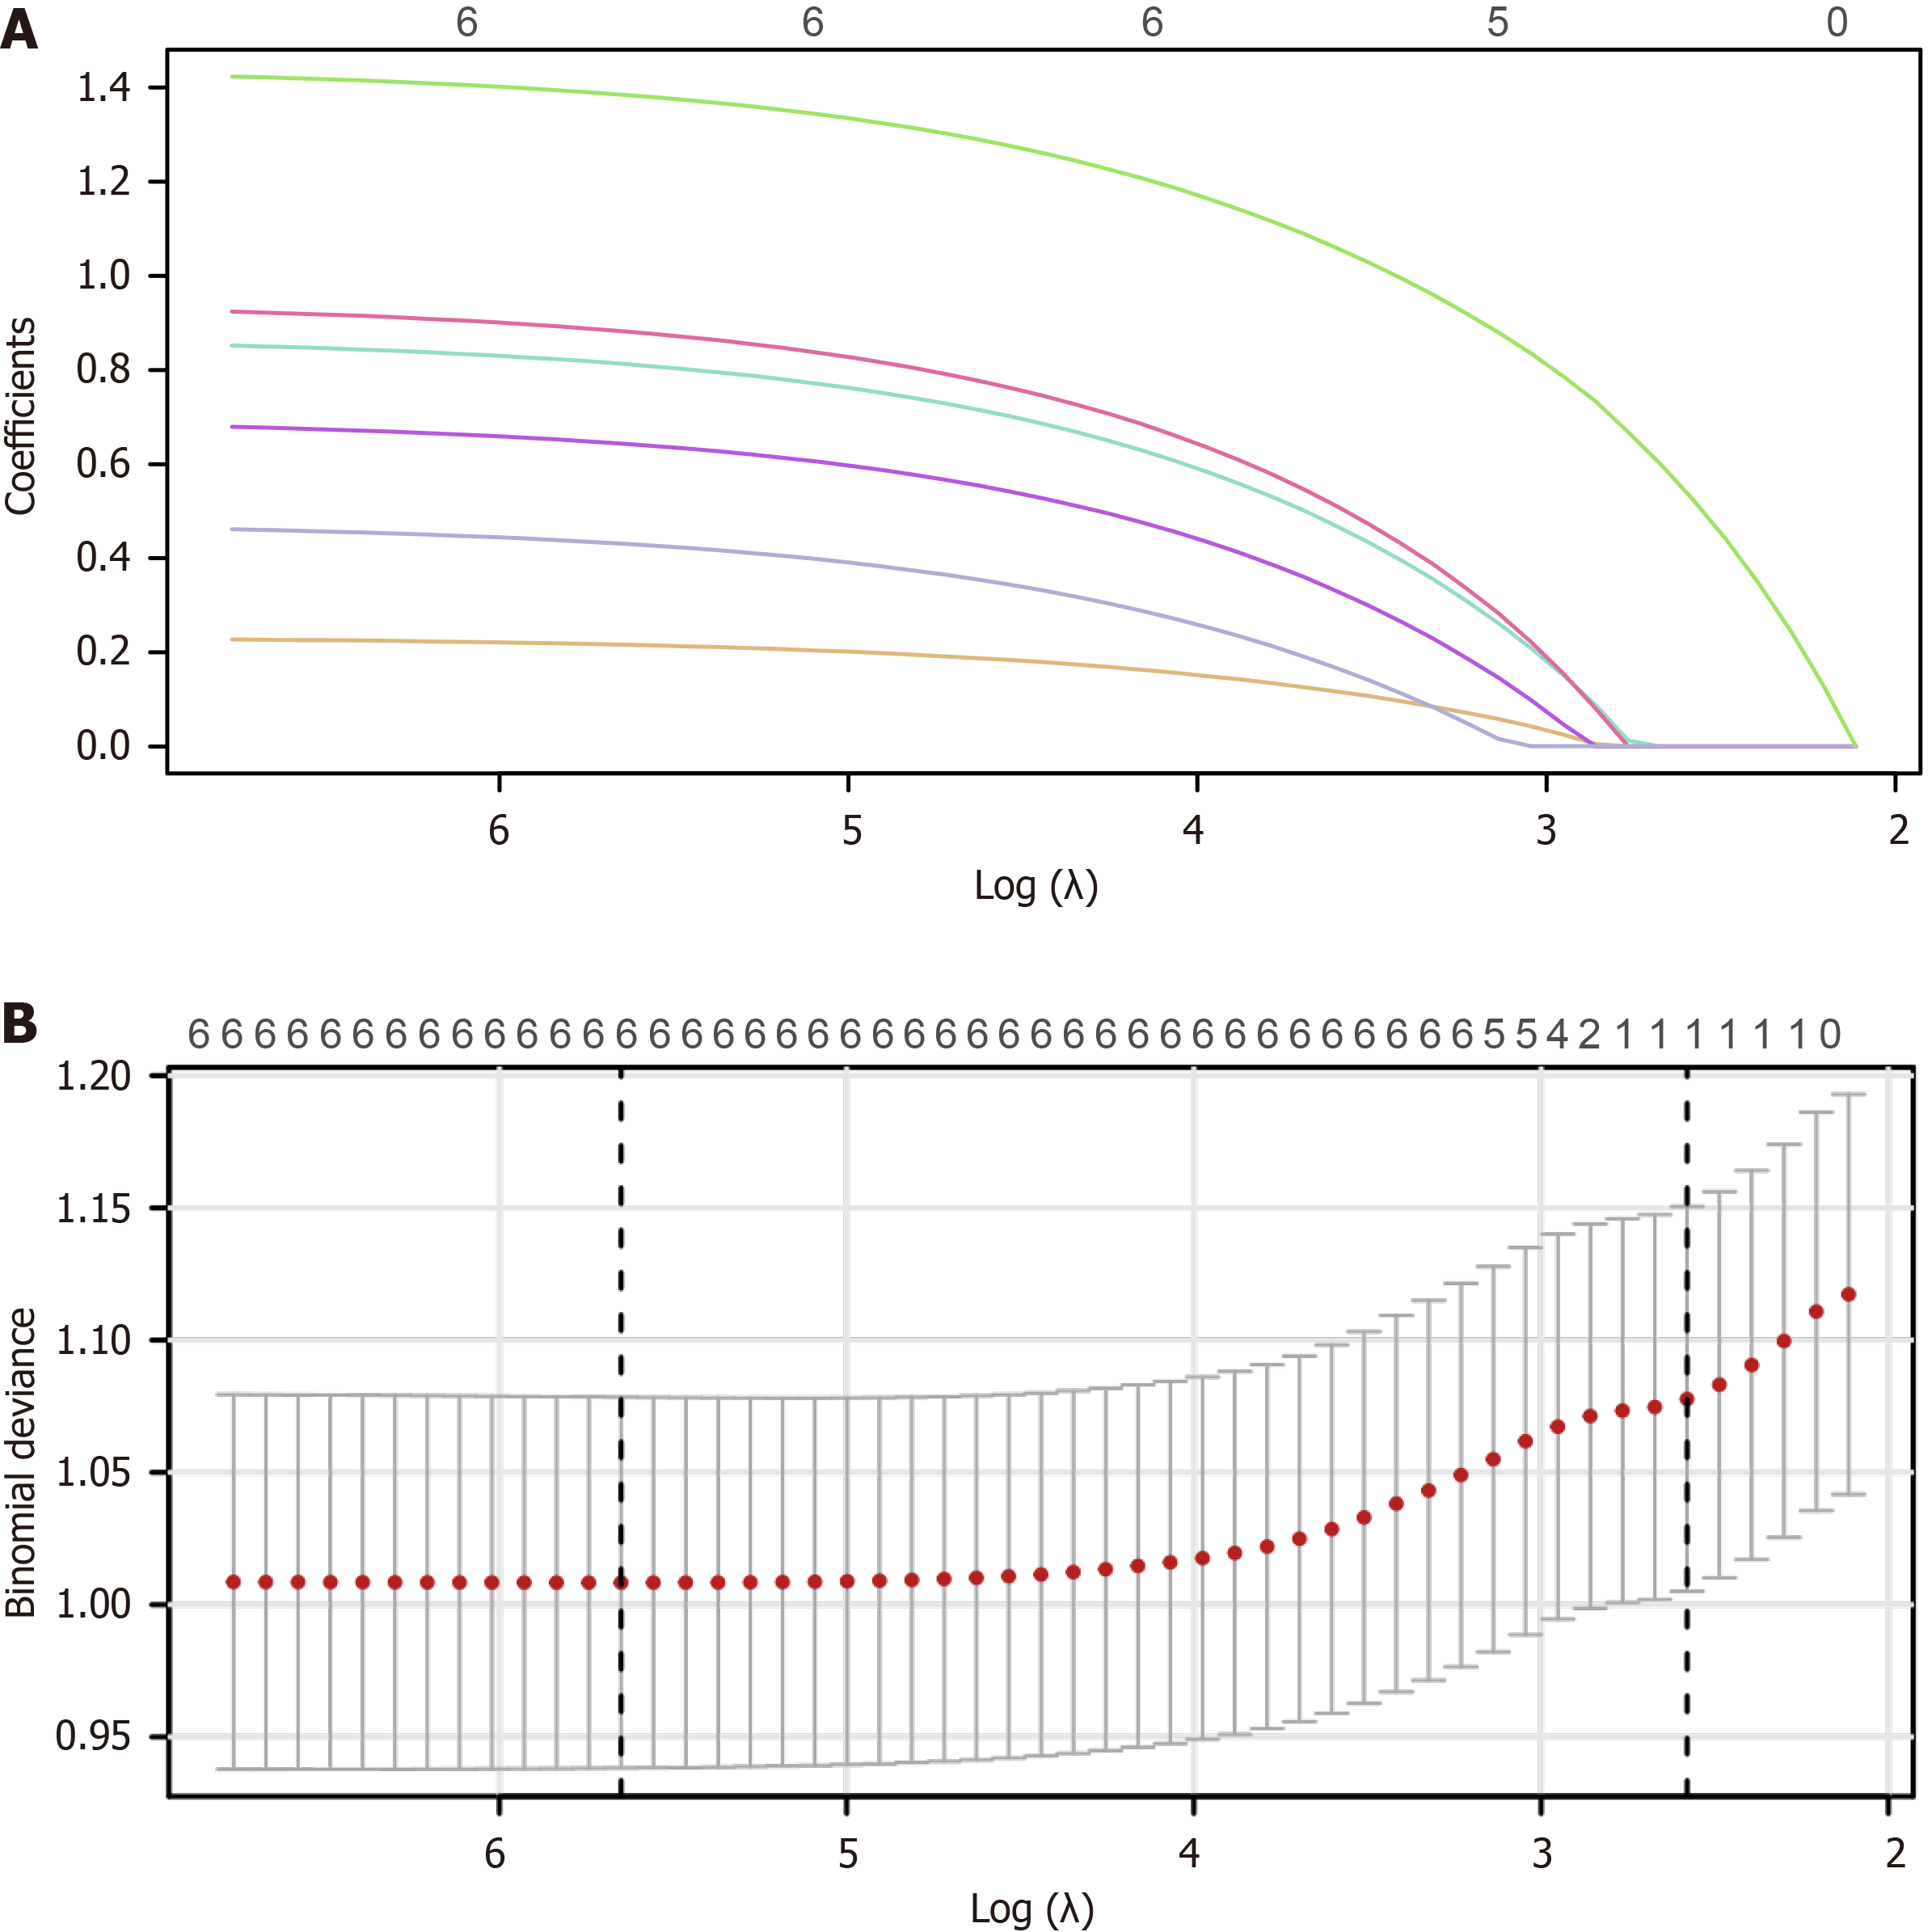
Figure 3 Least absolute shrinkage and selection operator regression screening of risk characteristic variables for poor prognosis.
A: Least absolute shrinkage and selection operator regression path diagram. As Log(λ) augments, the regression coefficients of the characteristic variables gradually contract to zero. When the λ value is small, most variables are included in the model. As the λ value escalates, the coefficients of some variables incline towards zero, and ultimately 6 key characteristic variables are screened out; B: Cross-validation curve diagram. The vertical axis represents the binomial deviation, and the horizontal axis denotes Log(λ). The optimal λ value is selected via 10-fold cross-validation. The dotted line position corresponds to the minimum value of λ (λ = 0.0035191), and the model corresponding to this value has the lowest deviation. Six characteristic variables are screened out at this point for the final model construction.
- Citation: Feng W, Ye QW, Wang QL, Chen SY, Ma Y, Meng FL. Predictors of one-year adverse outcomes after laparoscopic resection for hepatocellular carcinoma: Development and validation of an early-warning model. World J Gastroenterol 2026; 32(6): 113195
- URL: https://www.wjgnet.com/1007-9327/full/v32/i6/113195.htm
- DOI: https://dx.doi.org/10.3748/wjg.v32.i6.113195