
















©The Author(s) 2026.
World J Gastroenterol. Feb 14, 2026; 32(6): 113195
Published online Feb 14, 2026. doi: 10.3748/wjg.v32.i6.113195
Published online Feb 14, 2026. doi: 10.3748/wjg.v32.i6.113195
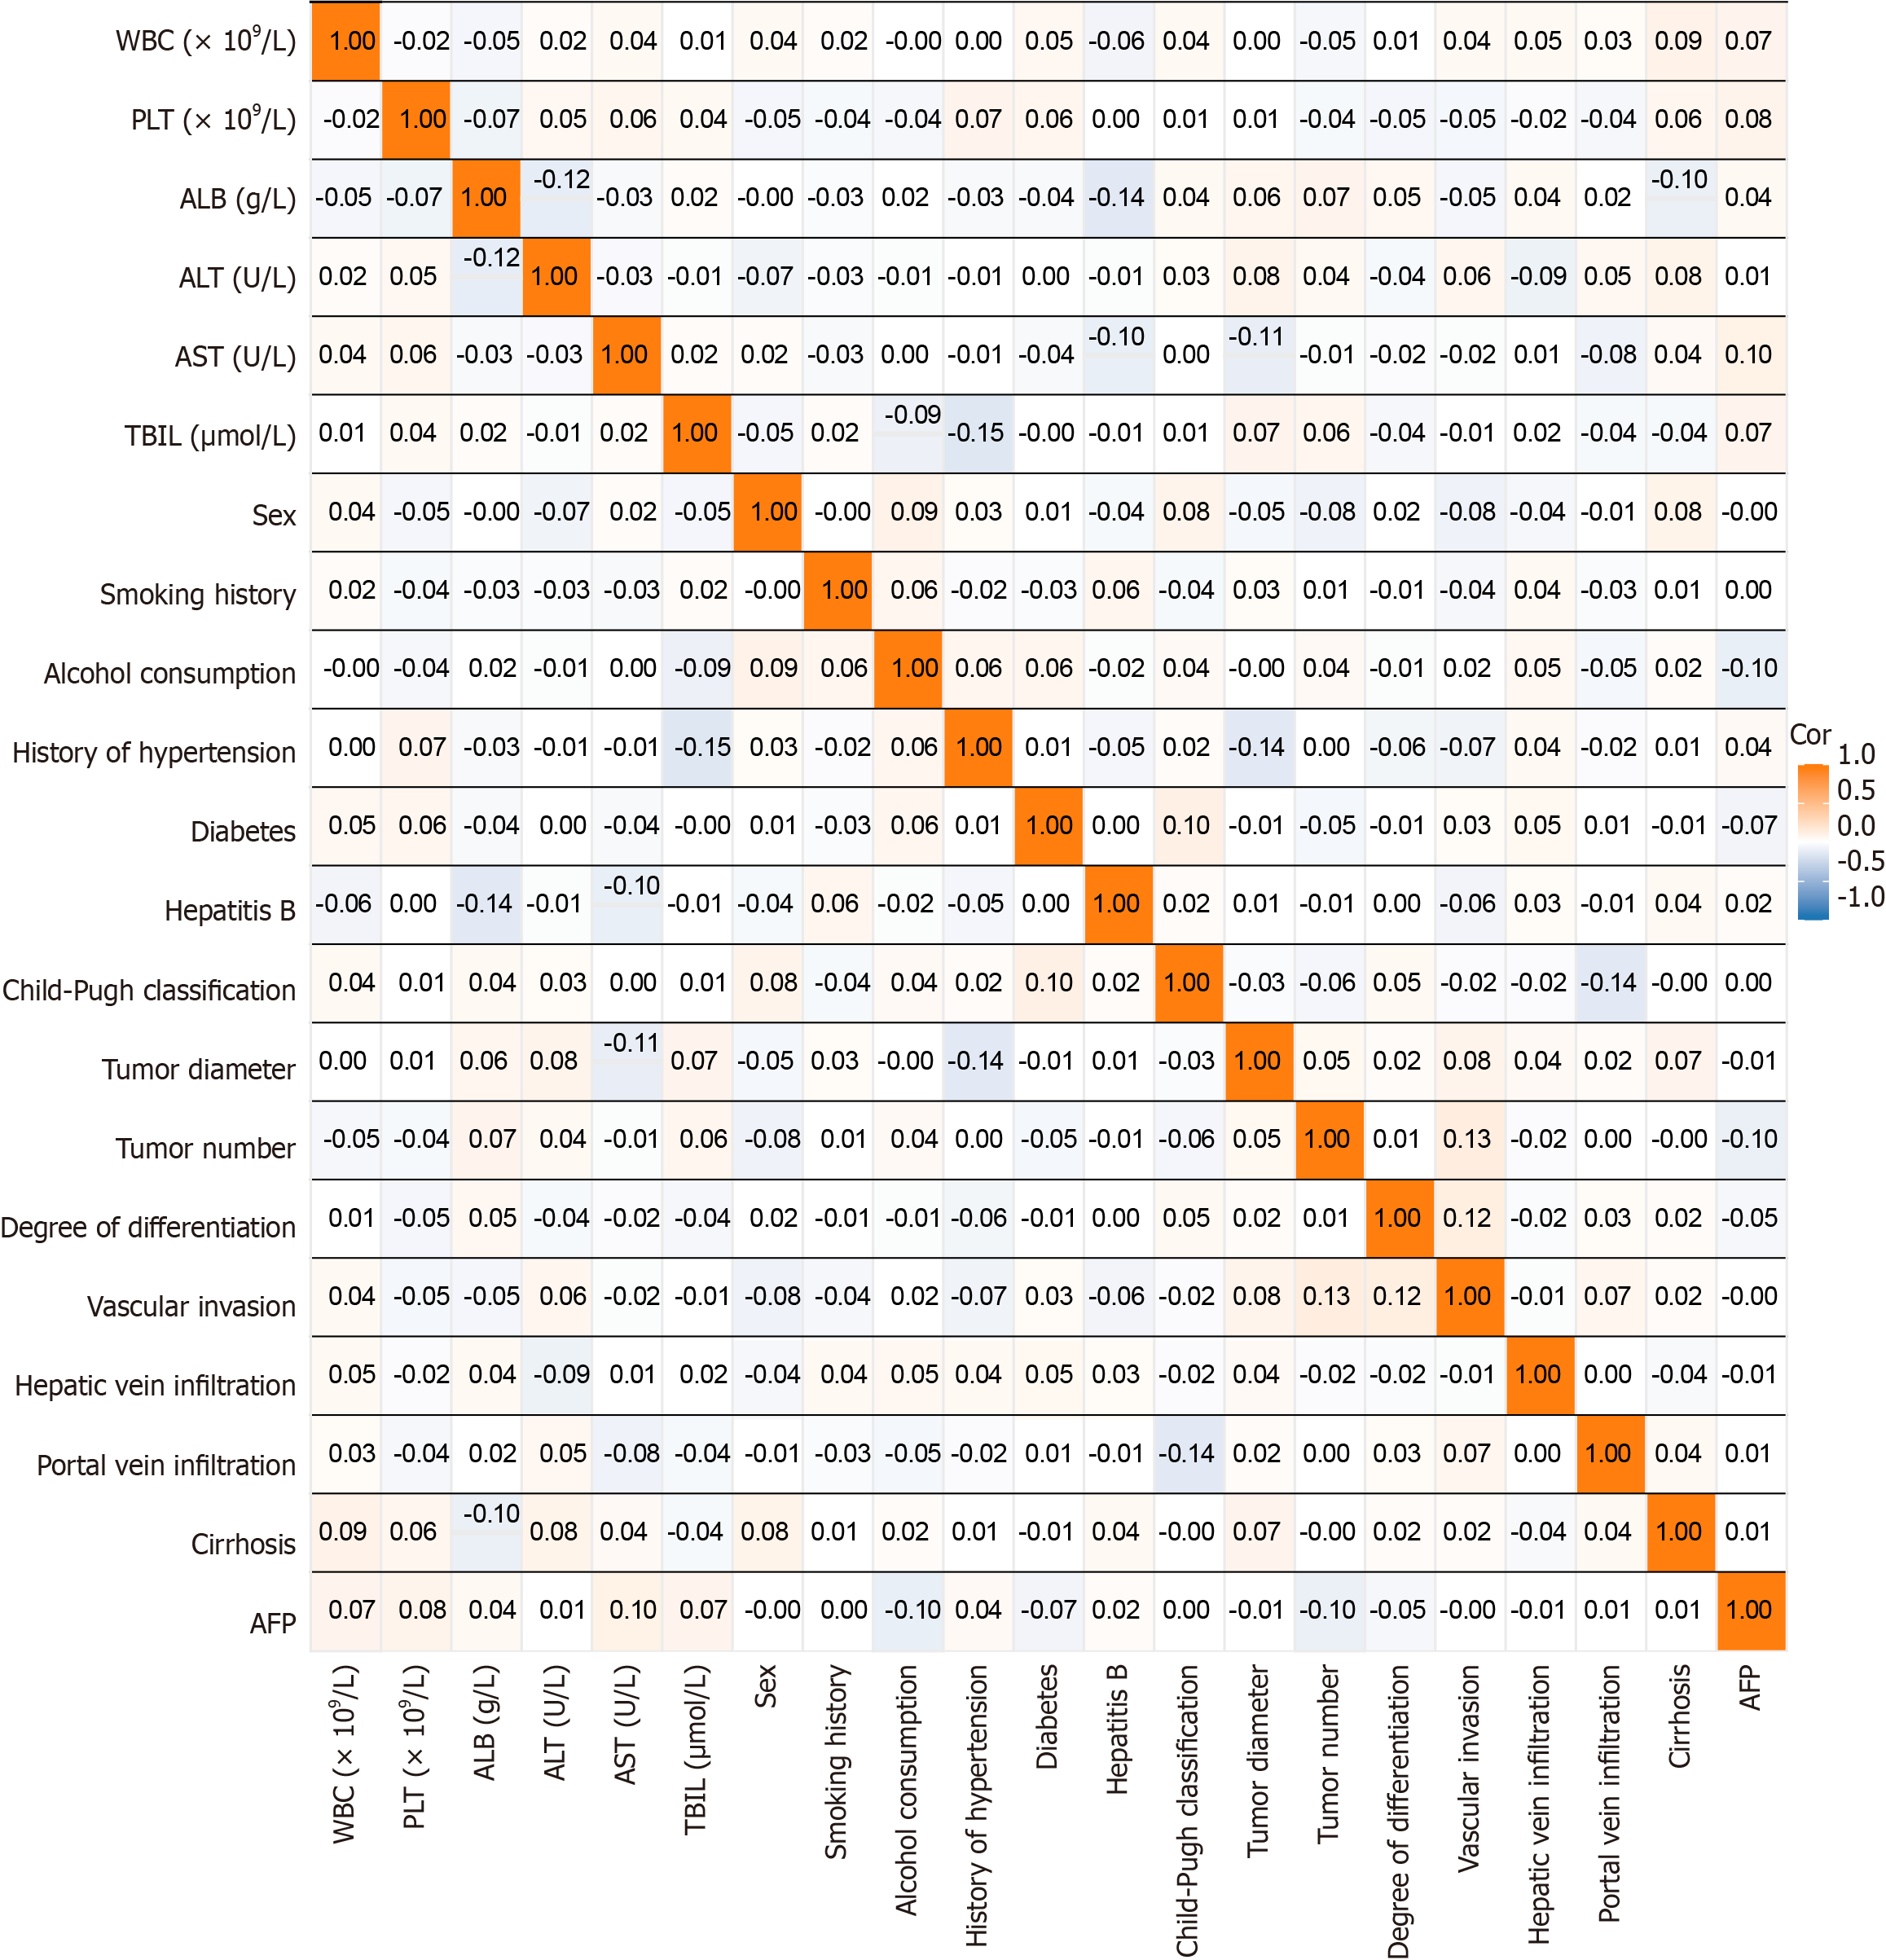
Figure 2 Correlation analysis of baseline data.
The figure shows the correlation coefficients between each clinical characteristic and laboratory indicator. The color depth represents the correlation coefficient’s magnitude, with orange and blue indicating positive and inverse correlations, respectively. A darker color signifies a stronger association. AFP: Alpha-fetoprotein; WBC: White blood cell; PLT: Platelet; ALB: Albumin; ALT: Alanine aminotransferase; AST: Aspartate aminotransferase; TBIL: Total bilirubin.
- Citation: Feng W, Ye QW, Wang QL, Chen SY, Ma Y, Meng FL. Predictors of one-year adverse outcomes after laparoscopic resection for hepatocellular carcinoma: Development and validation of an early-warning model. World J Gastroenterol 2026; 32(6): 113195
- URL: https://www.wjgnet.com/1007-9327/full/v32/i6/113195.htm
- DOI: https://dx.doi.org/10.3748/wjg.v32.i6.113195