
















©The Author(s) 2026.
World J Gastroenterol. Feb 14, 2026; 32(6): 113010
Published online Feb 14, 2026. doi: 10.3748/wjg.v32.i6.113010
Published online Feb 14, 2026. doi: 10.3748/wjg.v32.i6.113010
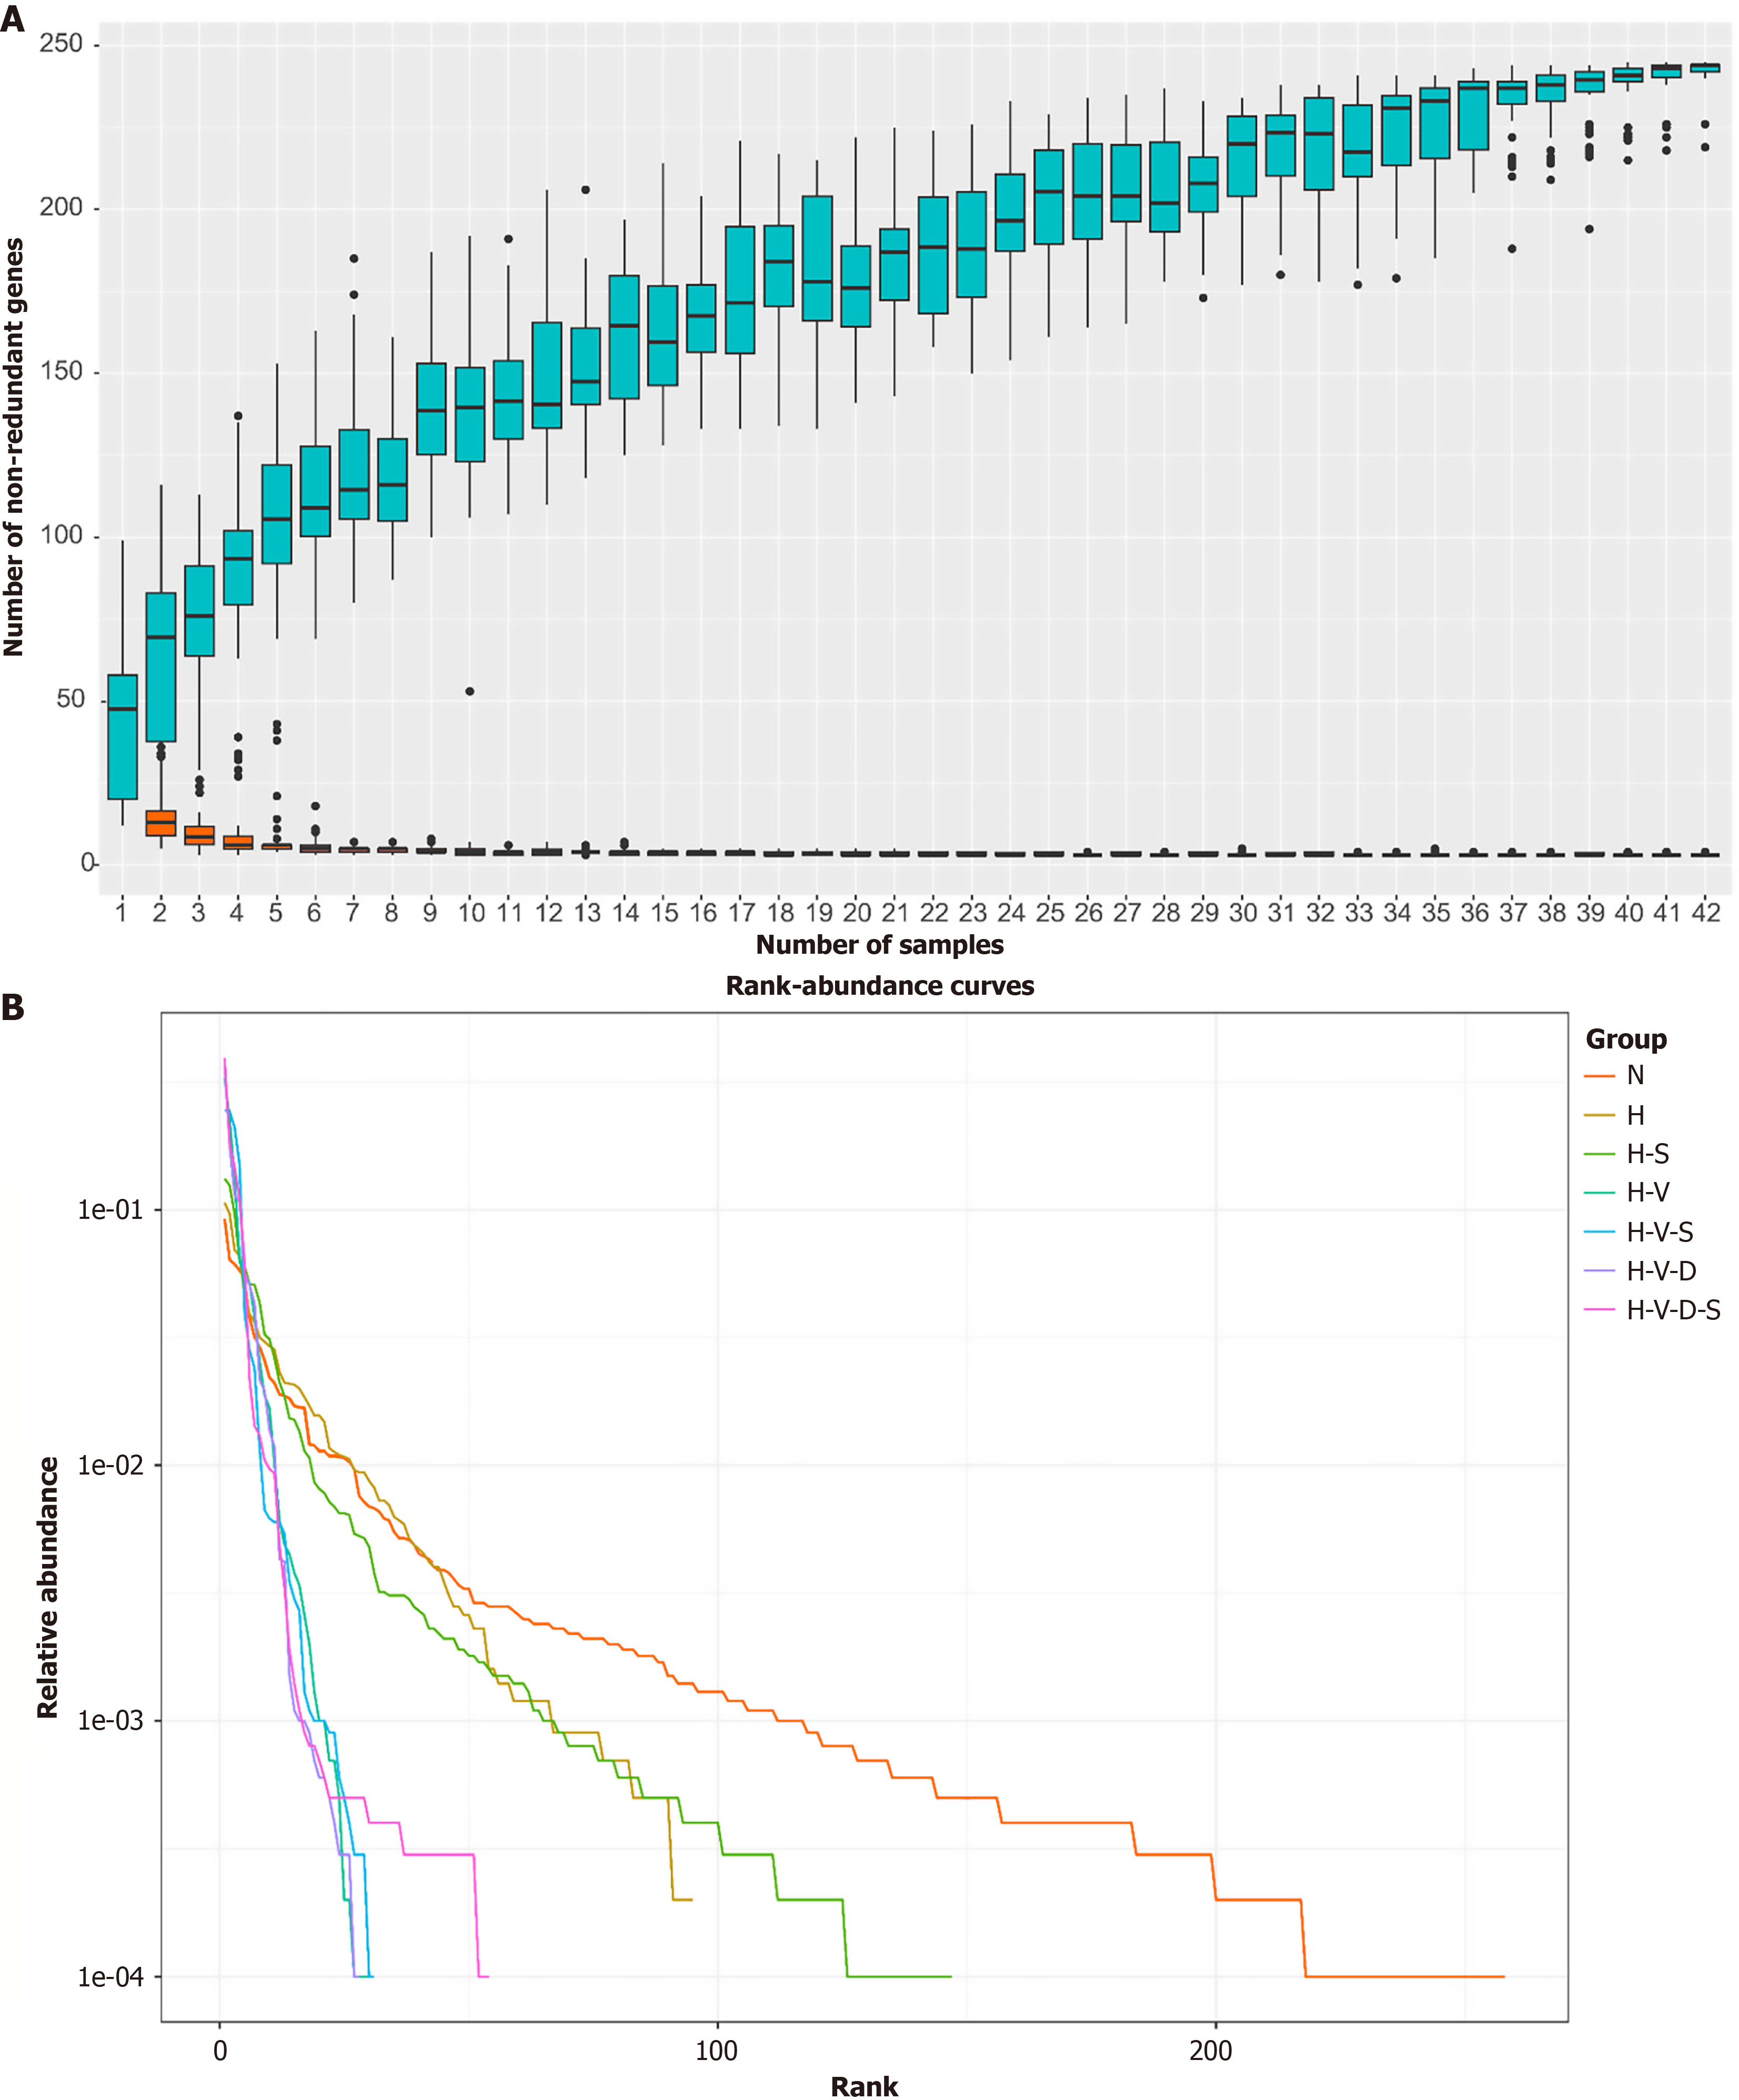
Figure 5 Species accumulation curve vs the rank-abundance curve analysis.
A: Cumulative plot of the genus-level species; B: Group rank-abundance plots.
- Citation: Yang PC, Xiao CY, Wang J, Yan CH, Li QY, Li SY, Li J, Zhang LJ, Dai CB. Effects and mechanism of Bifidobacterium on intestinal inflammation resulting from deoxycholic acid-induced M1 polarization of macrophages. World J Gastroenterol 2026; 32(6): 113010
- URL: https://www.wjgnet.com/1007-9327/full/v32/i6/113010.htm
- DOI: https://dx.doi.org/10.3748/wjg.v32.i6.113010