
















©The Author(s) 2026.
World J Gastroenterol. Feb 7, 2026; 32(5): 114752
Published online Feb 7, 2026. doi: 10.3748/wjg.v32.i5.114752
Published online Feb 7, 2026. doi: 10.3748/wjg.v32.i5.114752
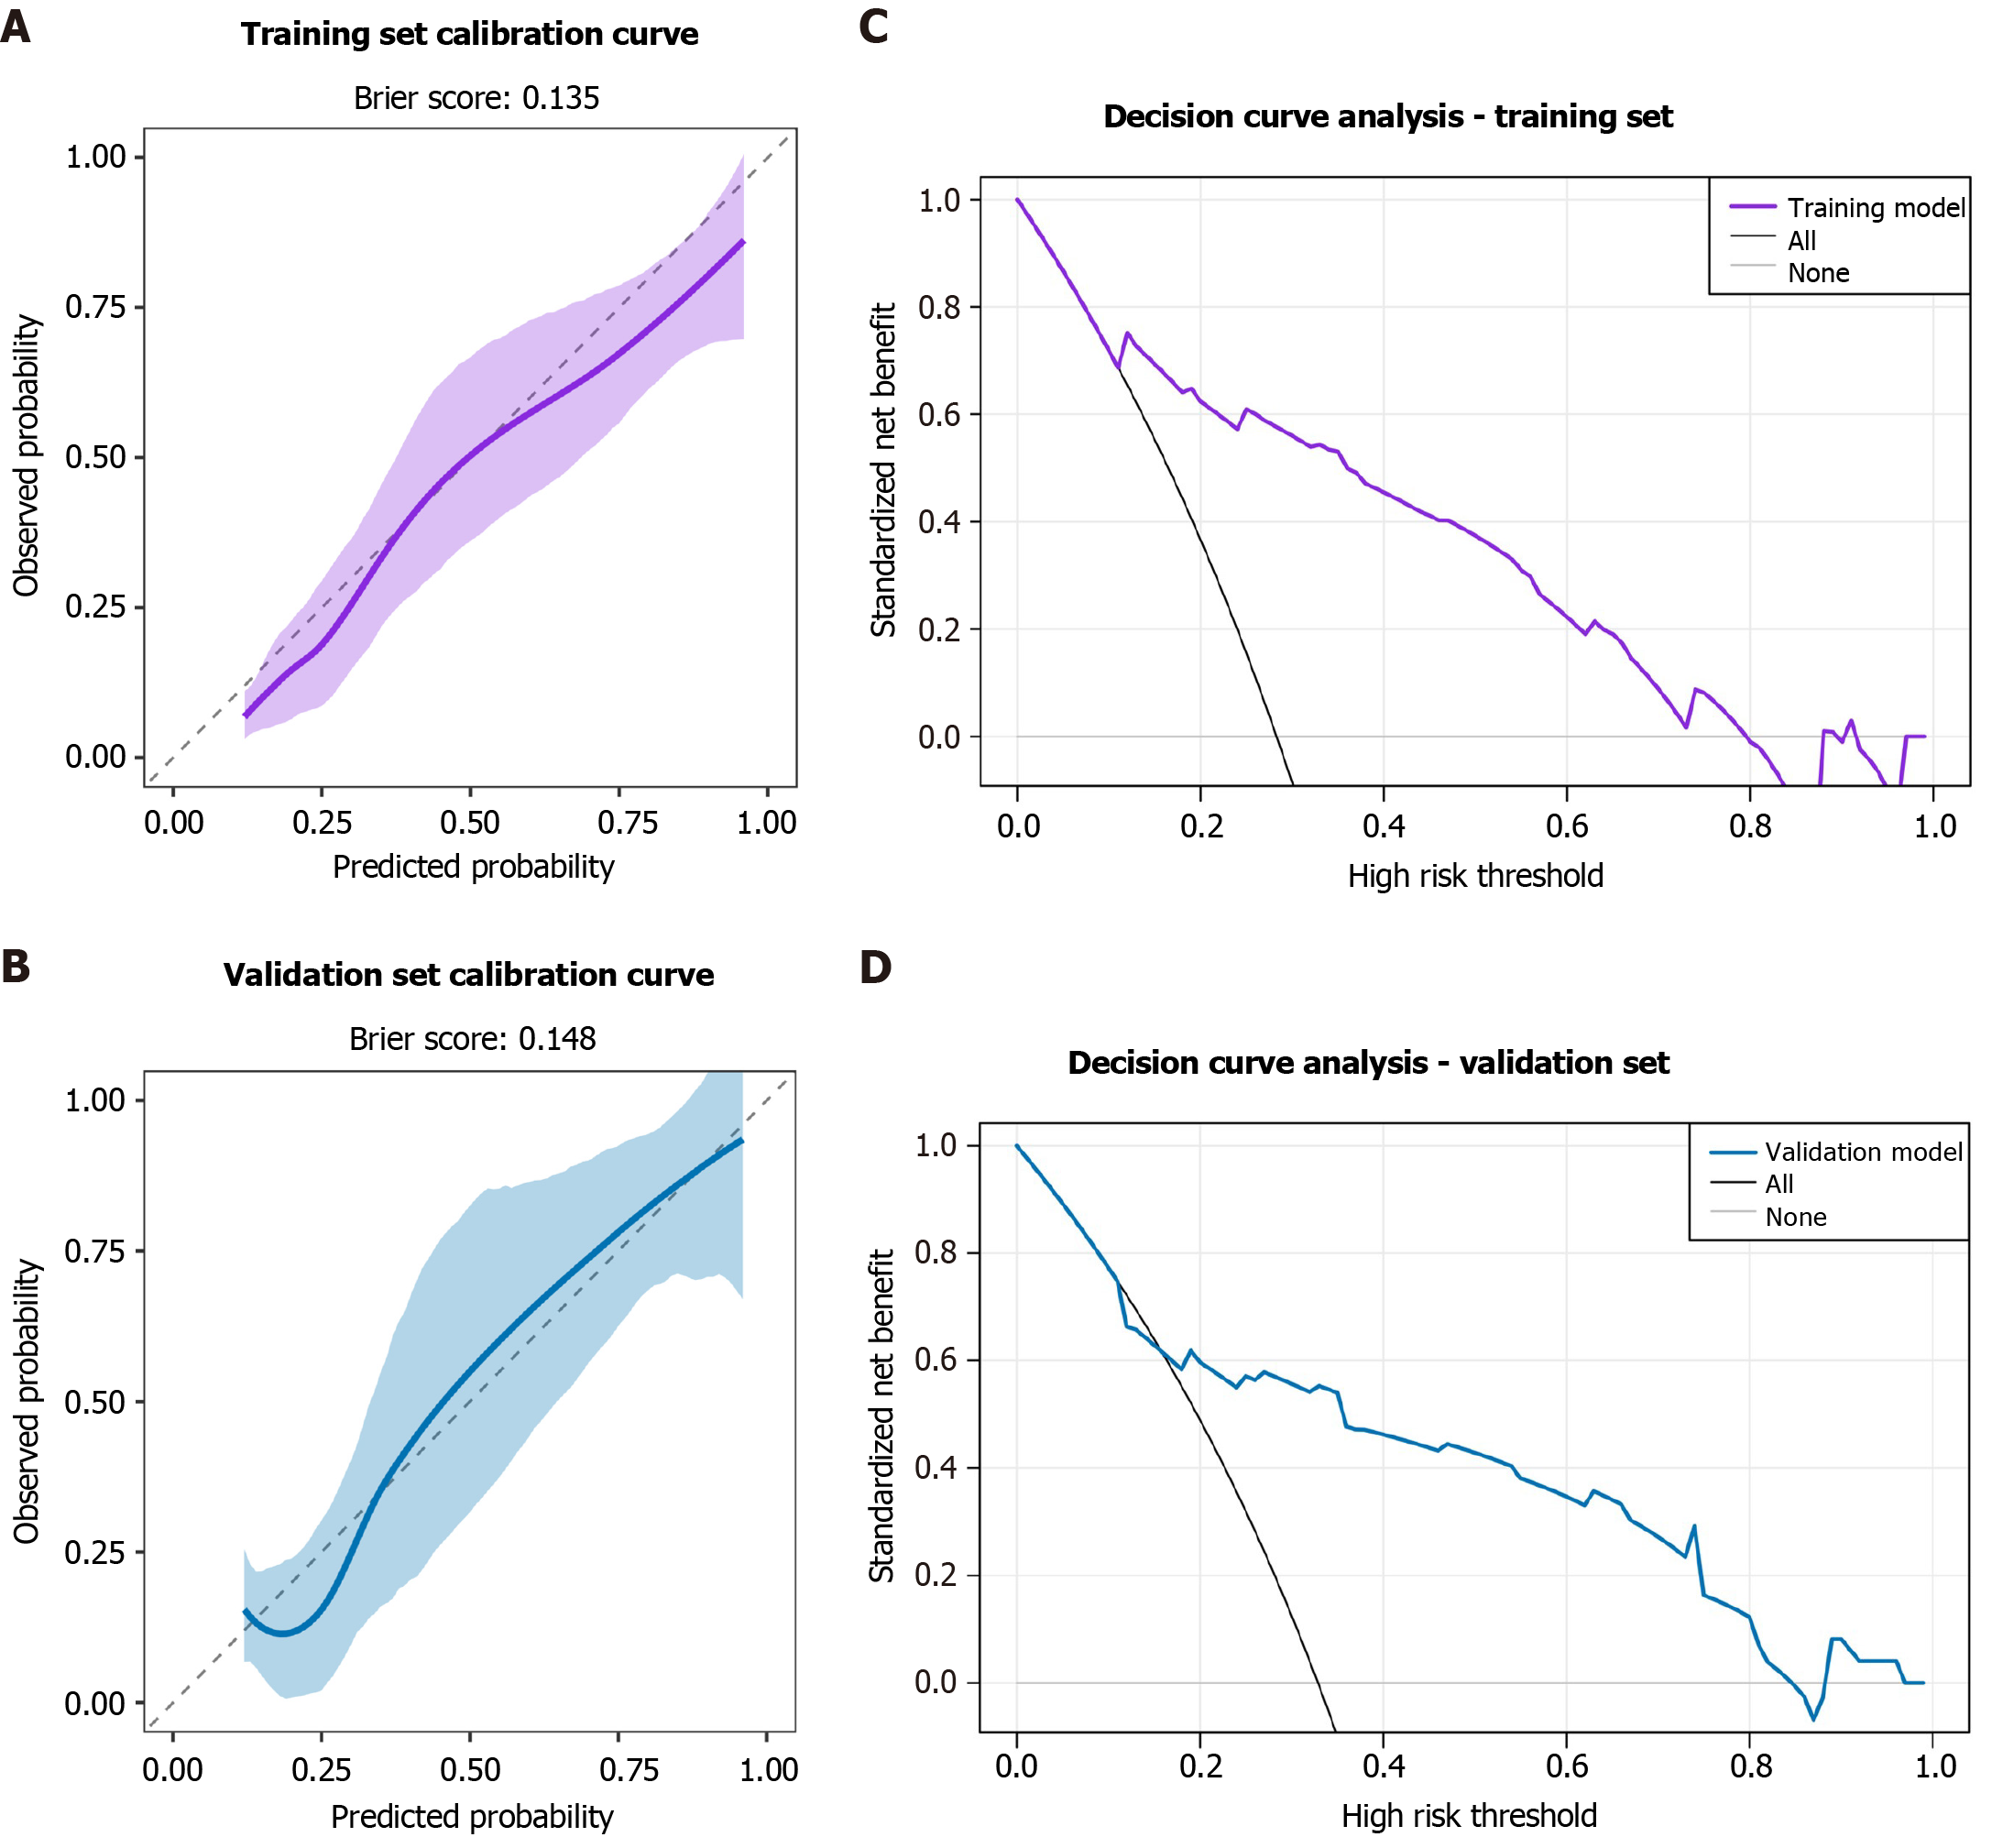
Figure 7 Calibration and decision curve analysis of the post-endoscopic submucosal dissection stenosis prediction model.
A and B: Calibration curves plot the predicted probability against the observed frequency of stenosis. The dashed diagonal line represents perfect calibration. The close fit of the solid line (our model) to the diagonal, along with low Brier scores (training: 0.135; validation: 0.148), indicates excellent agreement between predictions and actual outcomes; C and D: Decision curve analysis evaluates the clinical net benefit of the model across various threshold probabilities. The “prediction model” line shows that using the nomogram for clinical decision-making provides greater net benefit than the strategies of “treating all” or “treating none” of the patients across a wide range of risk thresholds do, demonstrating its potential clinical utility.
- Citation: Yang KZ, Chen L, Xu L, Xu BX, Li MY, Wang Z, Lu Q. Correlation between sarcopenia and esophageal stenosis following endoscopic submucosal dissection and construction of a postoperative stenosis risk model. World J Gastroenterol 2026; 32(5): 114752
- URL: https://www.wjgnet.com/1007-9327/full/v32/i5/114752.htm
- DOI: https://dx.doi.org/10.3748/wjg.v32.i5.114752