
















©The Author(s) 2026.
World J Gastroenterol. Feb 7, 2026; 32(5): 114752
Published online Feb 7, 2026. doi: 10.3748/wjg.v32.i5.114752
Published online Feb 7, 2026. doi: 10.3748/wjg.v32.i5.114752
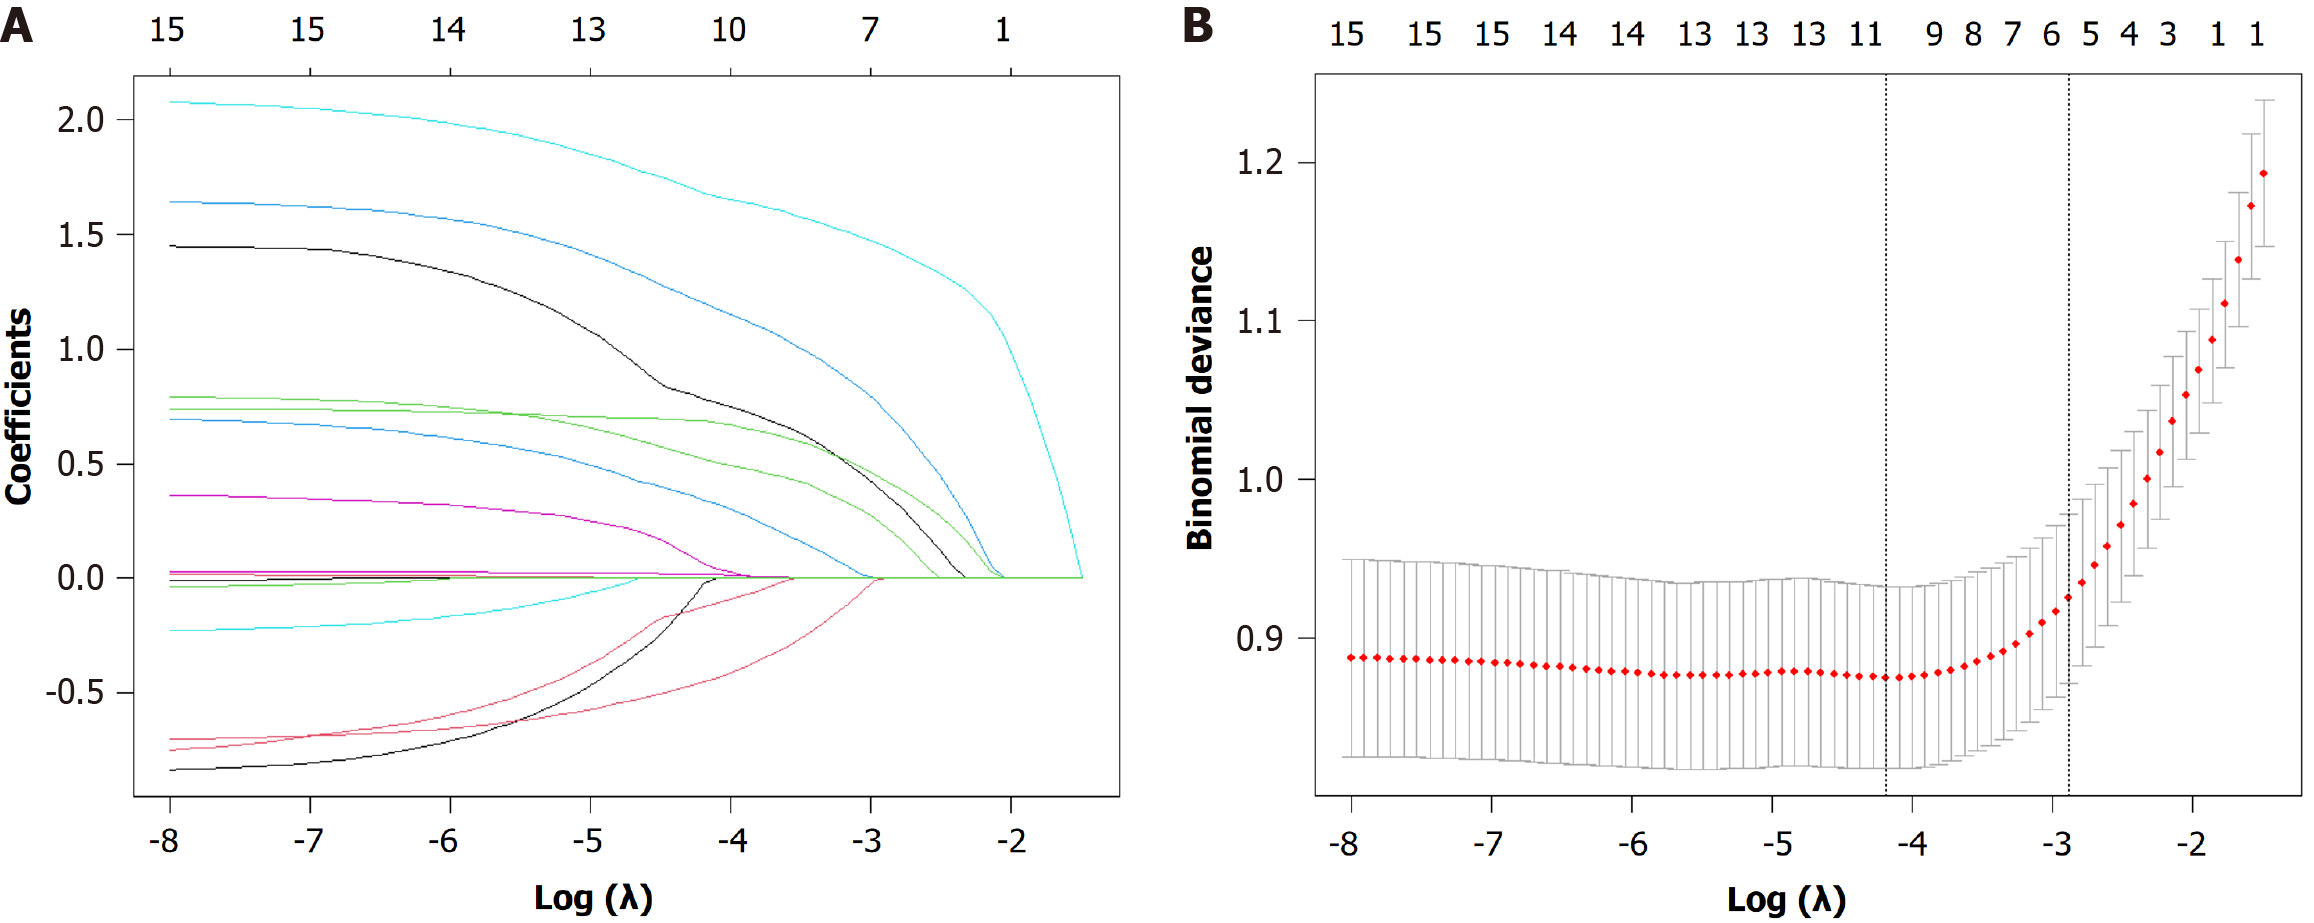
Figure 5 Variable selection using the least absolute shrinkage and selection operator regression model.
A: The least absolute shrinkage and selection operator coefficient profile plot shows the trajectory of each variable's coefficient as the penalty parameter (lambda) increases. Each colored line represents a variable; B: The 10-fold cross-validation plot for tuning parameter (lambda) selection. The left vertical dashed line indicates the lambda value at which the model achieves minimum binomial deviance (λ.min), whereas the right dashed line represents the most regularized model within one standard error of the minimum (λ.1 se). The final predictors were selected at the λ.1 se value to obtain a more parsimonious model.
- Citation: Yang KZ, Chen L, Xu L, Xu BX, Li MY, Wang Z, Lu Q. Correlation between sarcopenia and esophageal stenosis following endoscopic submucosal dissection and construction of a postoperative stenosis risk model. World J Gastroenterol 2026; 32(5): 114752
- URL: https://www.wjgnet.com/1007-9327/full/v32/i5/114752.htm
- DOI: https://dx.doi.org/10.3748/wjg.v32.i5.114752