
















©The Author(s) 2026.
World J Gastroenterol. Feb 7, 2026; 32(5): 114752
Published online Feb 7, 2026. doi: 10.3748/wjg.v32.i5.114752
Published online Feb 7, 2026. doi: 10.3748/wjg.v32.i5.114752
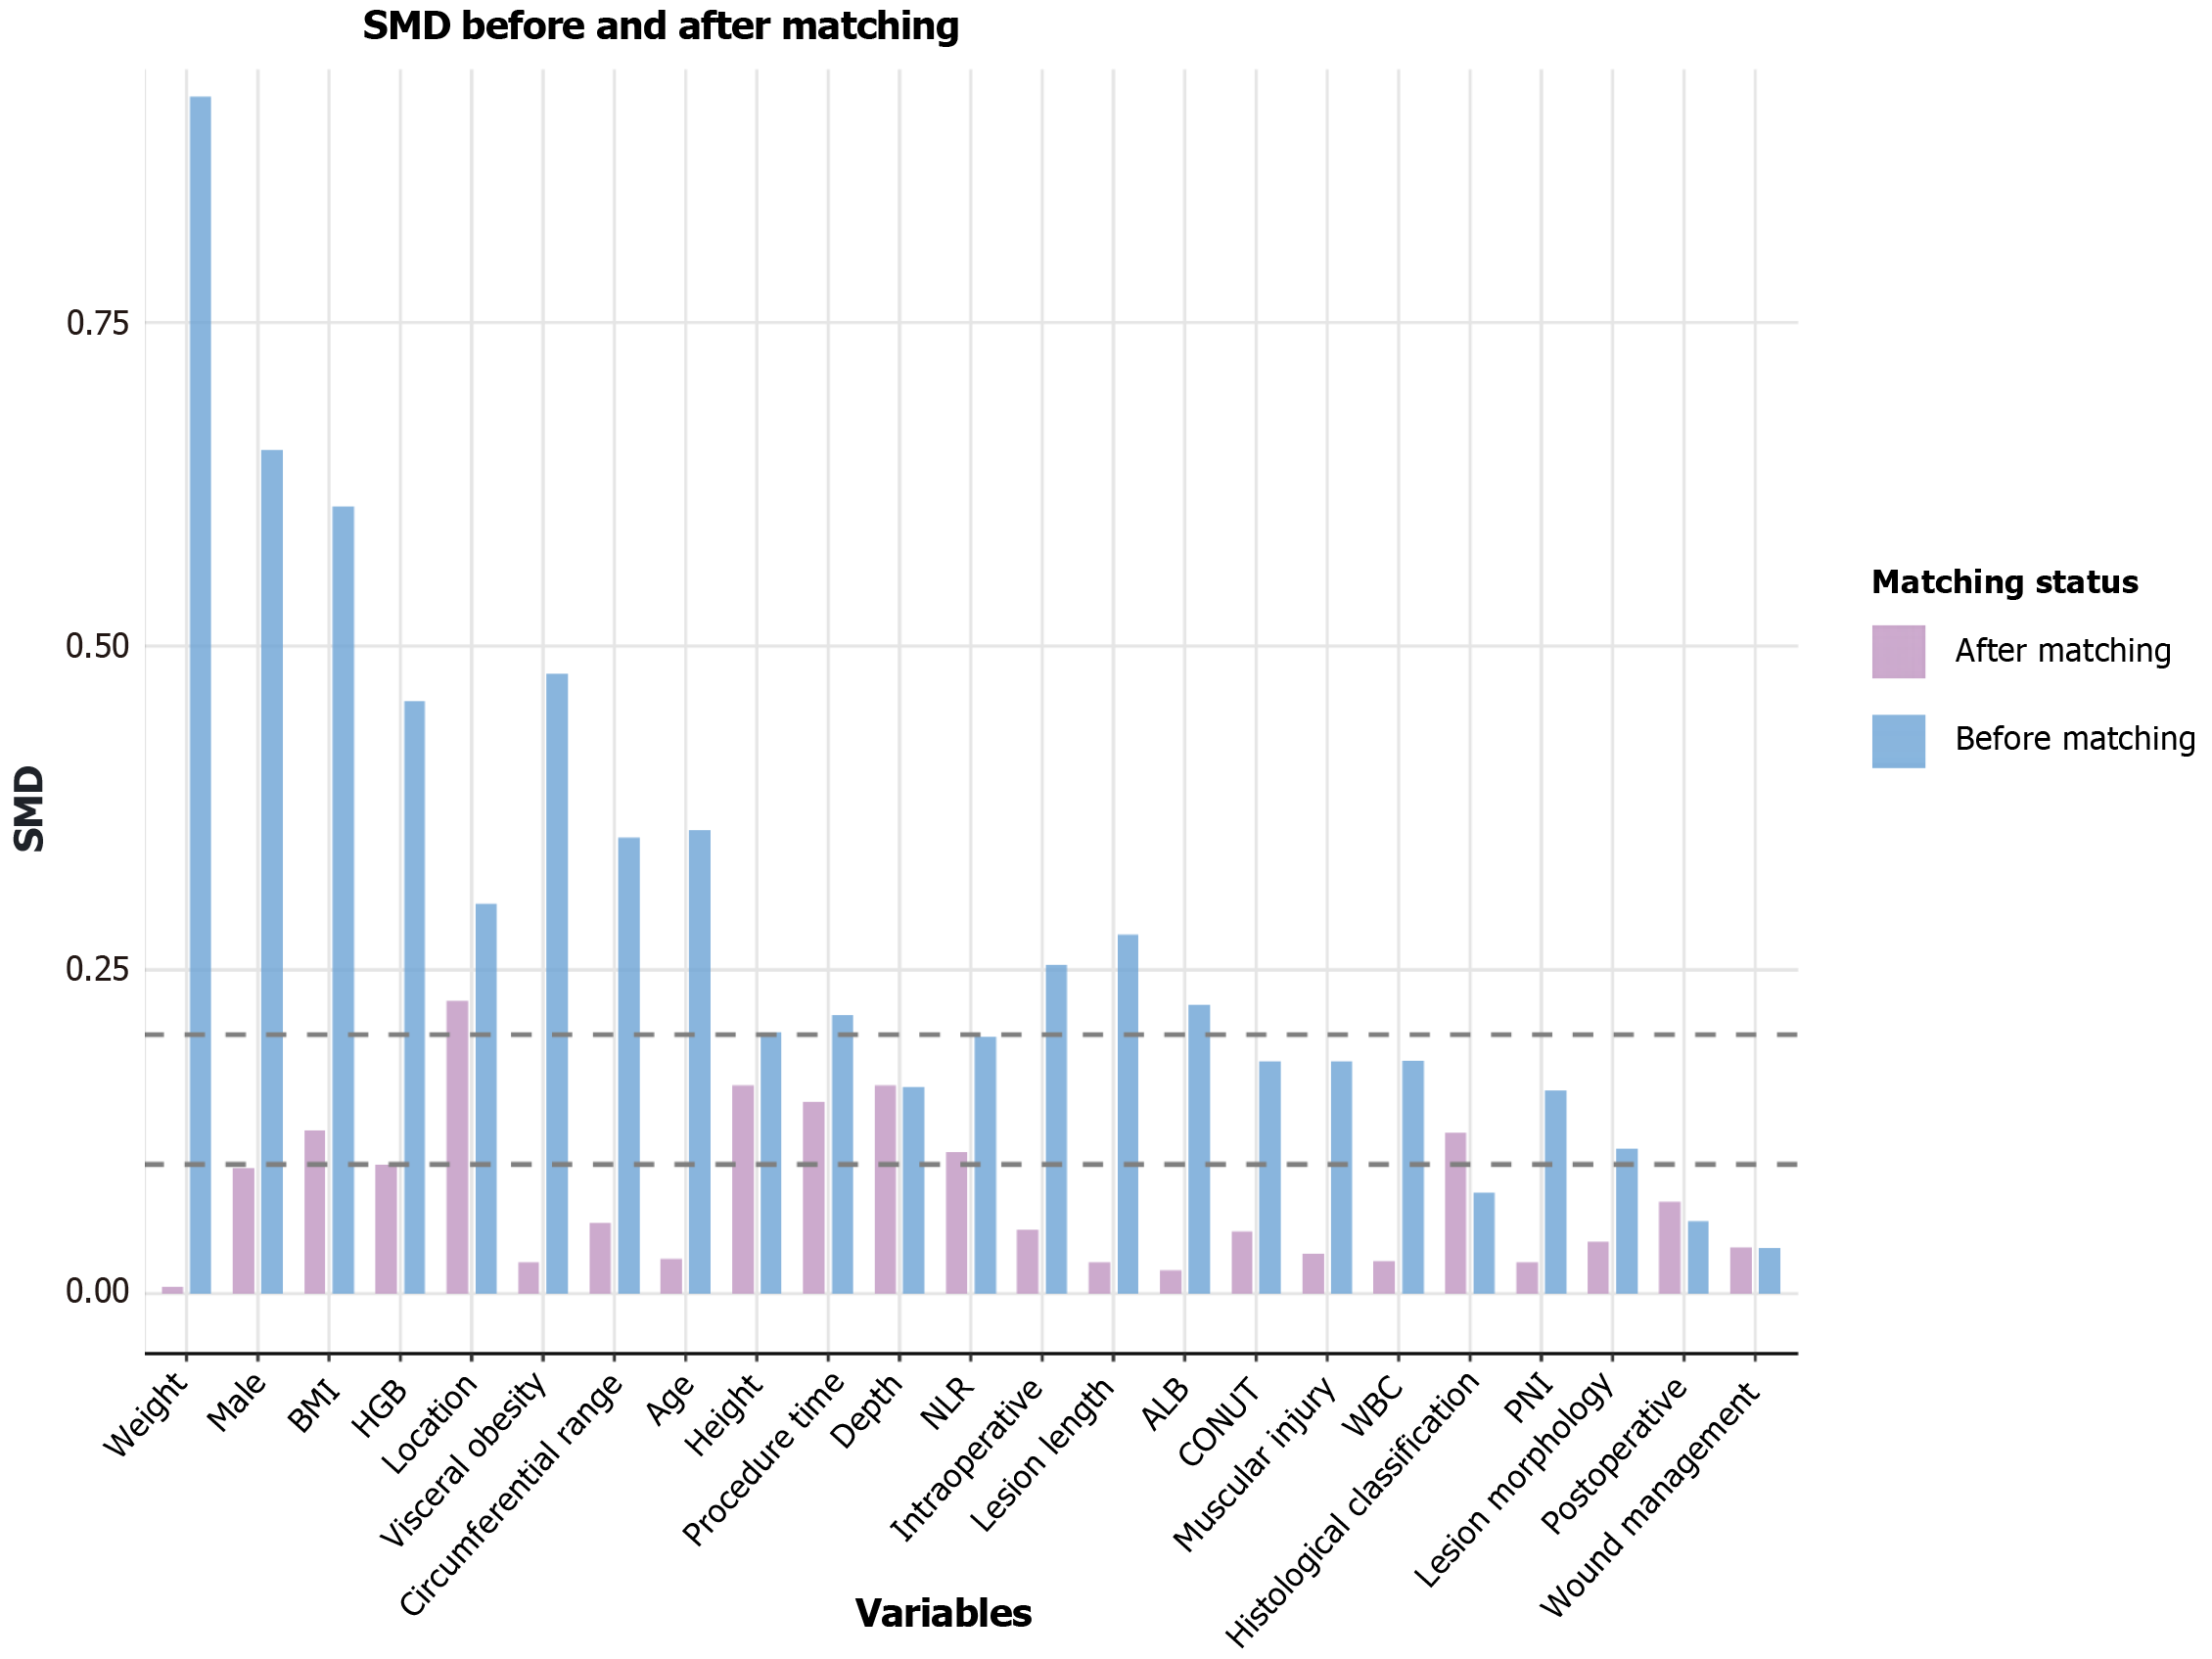
Figure 4 Assessment of covariate balance via standardized mean differences.
The plot compares the standardized mean differences (SMDs) of the baseline variables before and after propensity score matching (caliper = 0.2). The results demonstrate that matching effectively improved the balance between the patient groups, as most post-matching SMDs fell below the 01 threshold. SMD: Standardized mean difference; BMI: Body mass index; CONUT: Controlling Nutritional Status score; PNI: Prognostic Nutritional Index; NLR: Neutrophil-to-lymphocyte ratio; WBC: White blood cell count; HGB: Hemoglobin concentration; ALB: Serum albumin concentration.
- Citation: Yang KZ, Chen L, Xu L, Xu BX, Li MY, Wang Z, Lu Q. Correlation between sarcopenia and esophageal stenosis following endoscopic submucosal dissection and construction of a postoperative stenosis risk model. World J Gastroenterol 2026; 32(5): 114752
- URL: https://www.wjgnet.com/1007-9327/full/v32/i5/114752.htm
- DOI: https://dx.doi.org/10.3748/wjg.v32.i5.114752