
















©The Author(s) 2026.
World J Gastroenterol. Feb 7, 2026; 32(5): 114752
Published online Feb 7, 2026. doi: 10.3748/wjg.v32.i5.114752
Published online Feb 7, 2026. doi: 10.3748/wjg.v32.i5.114752
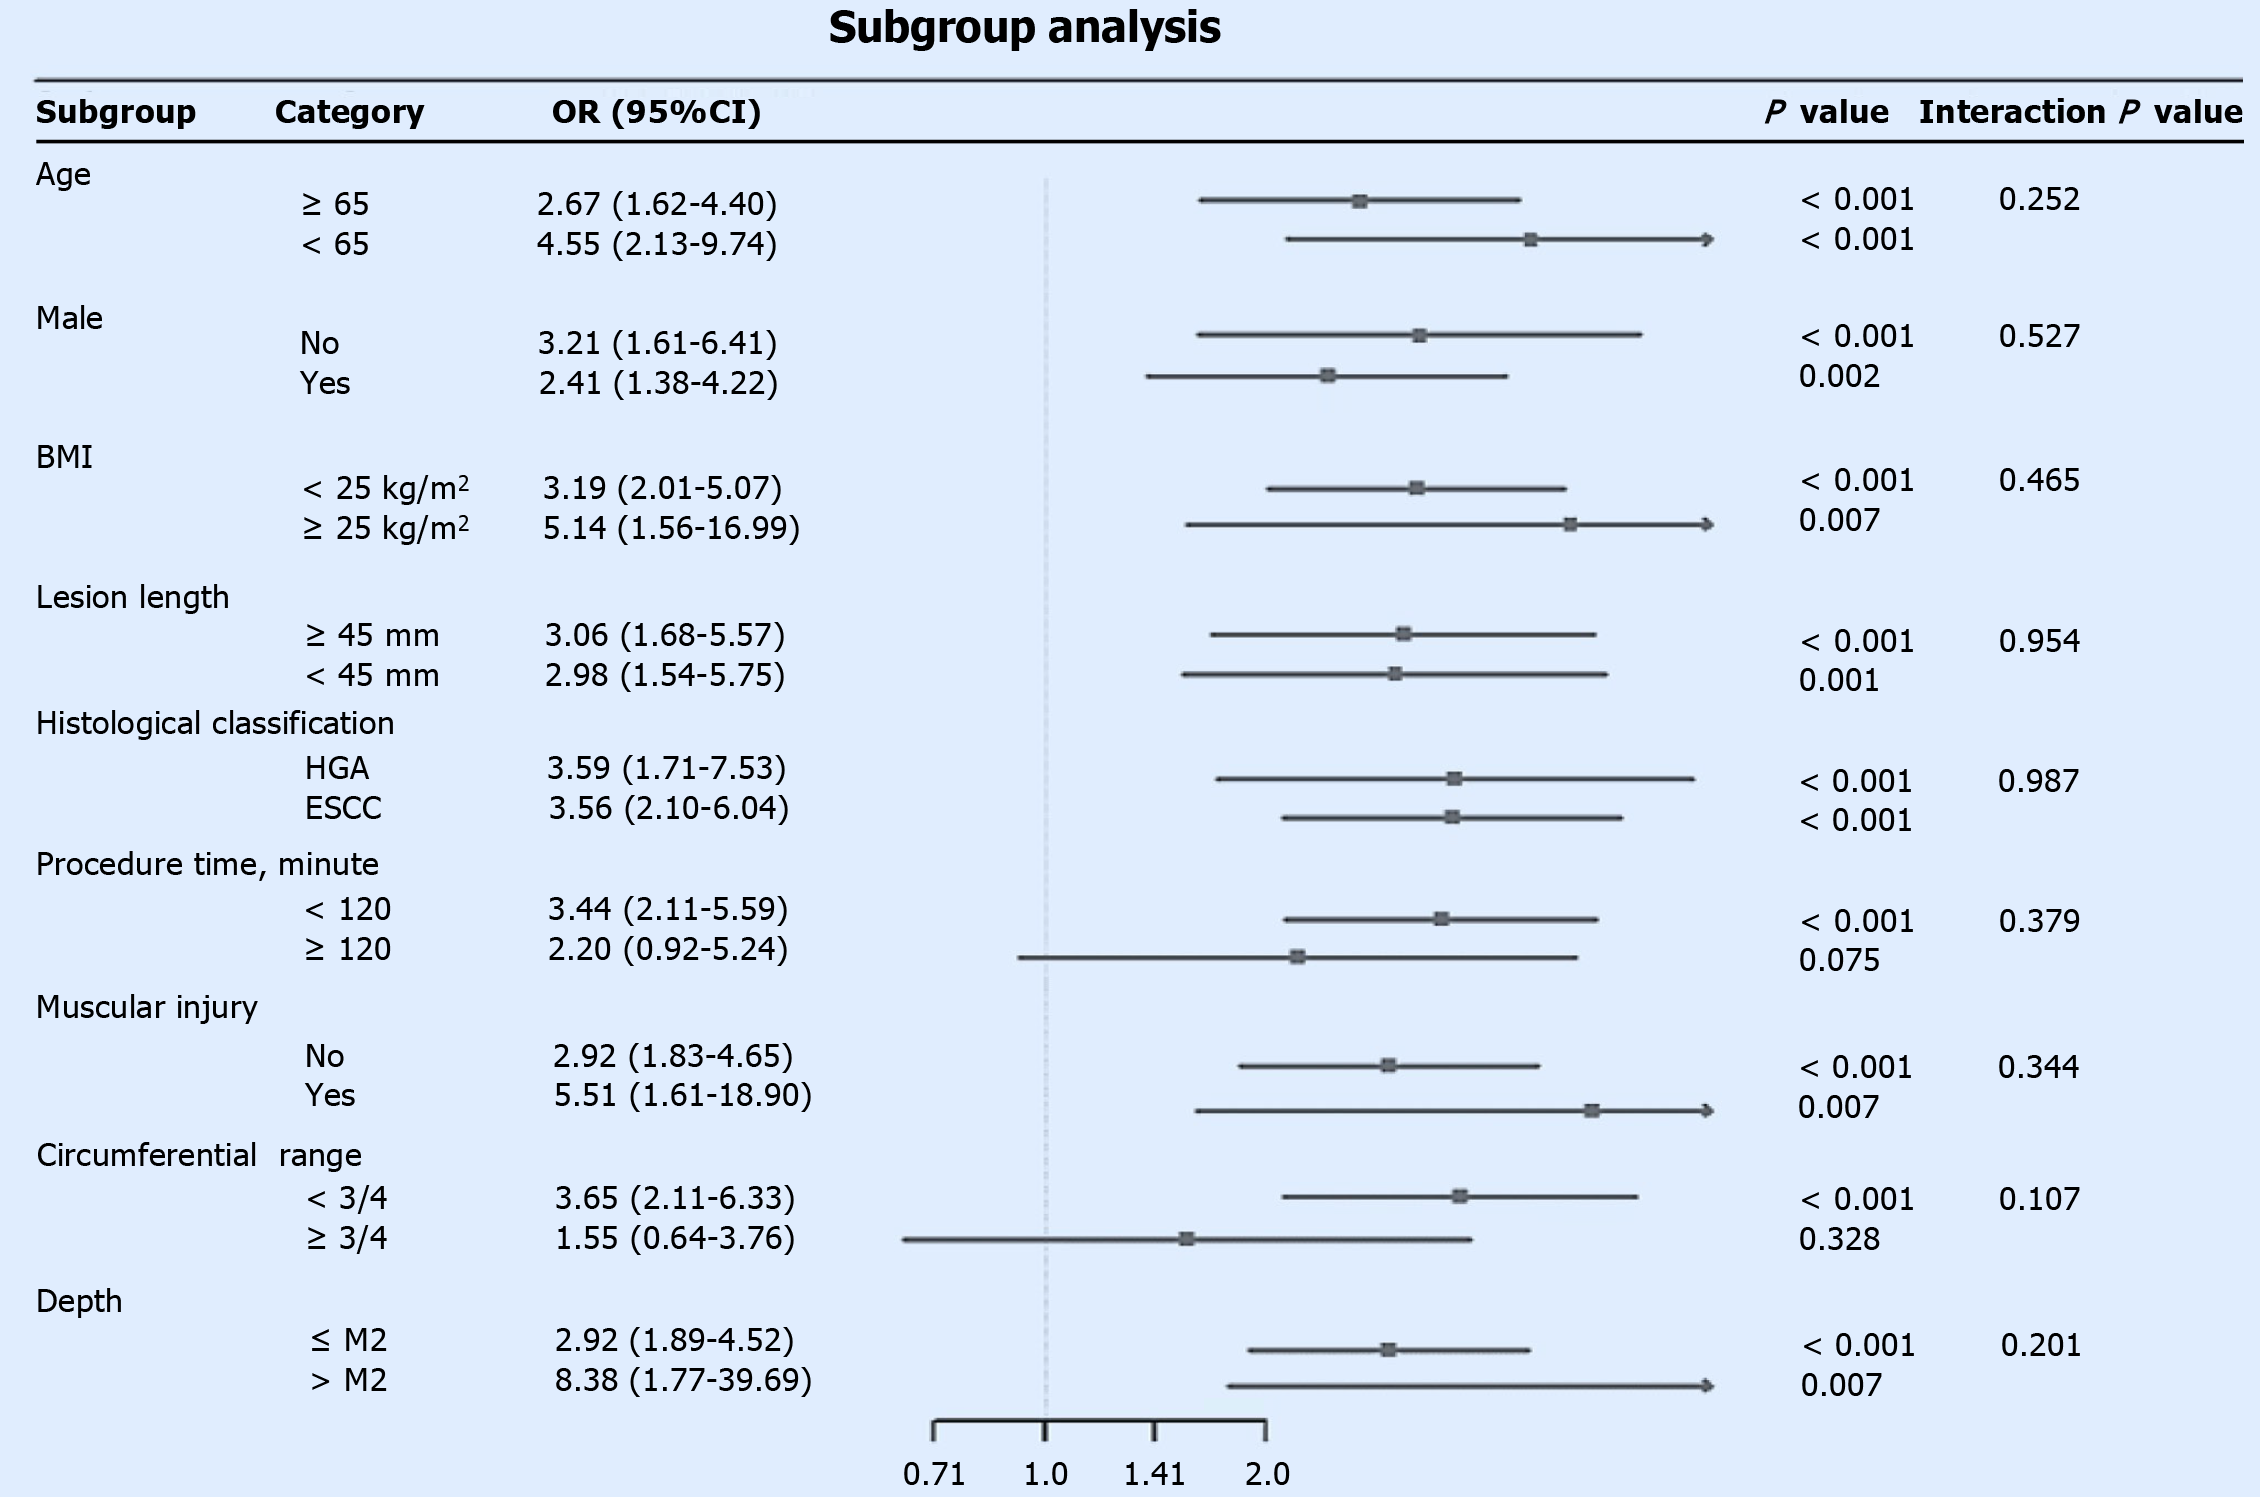
Figure 3 Subgroup analysis of the association between sarcopenia and postoperative stenosis risk.
This forest plot displays the odds ratios (ORs) and 95% confidence intervals for the associations across various patient subgroups. An OR greater than 1 indicates a higher risk of stenosis in the sarcopenia group. The 'Interaction P' value tests whether the effect of sarcopenia on stenosis risk differs significantly between the subgroups. Circumferential: Circumferential resection range; ≤ M2: Invasion depth limited to the lamina propria mucosae or shallower; > M2: Invasion depth beyond the lamina propria mucosae. OR: Odds ratio; BMI: Body mass index; HGA: High-grade adenoma; ESCC: Esophageal squamous cell carcinoma.
- Citation: Yang KZ, Chen L, Xu L, Xu BX, Li MY, Wang Z, Lu Q. Correlation between sarcopenia and esophageal stenosis following endoscopic submucosal dissection and construction of a postoperative stenosis risk model. World J Gastroenterol 2026; 32(5): 114752
- URL: https://www.wjgnet.com/1007-9327/full/v32/i5/114752.htm
- DOI: https://dx.doi.org/10.3748/wjg.v32.i5.114752