
















©The Author(s) 2026.
World J Gastroenterol. Feb 7, 2026; 32(5): 114752
Published online Feb 7, 2026. doi: 10.3748/wjg.v32.i5.114752
Published online Feb 7, 2026. doi: 10.3748/wjg.v32.i5.114752
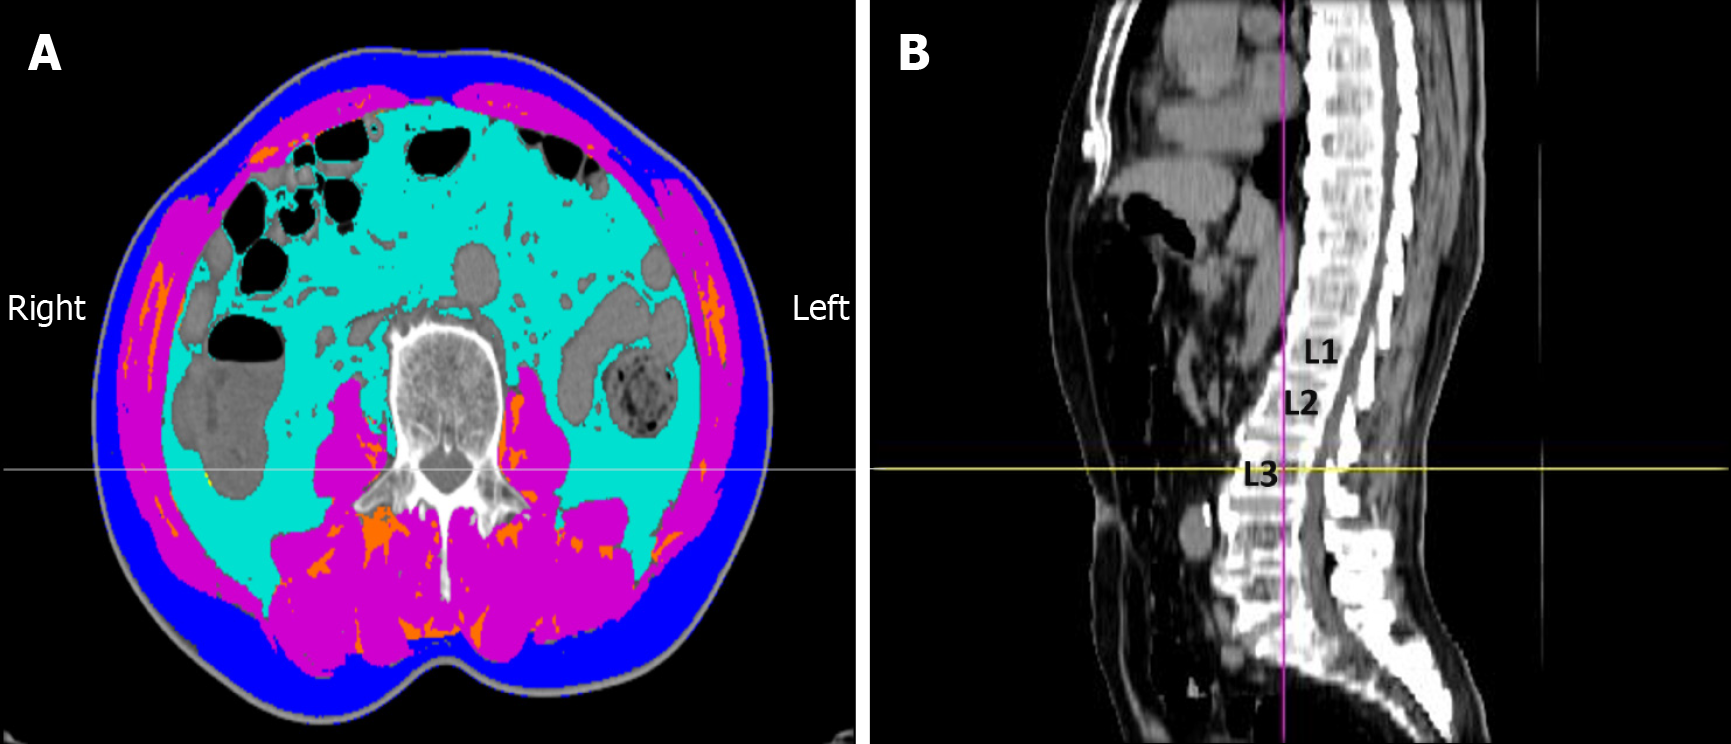
Figure 1 Assessment of body composition by computed tomography at the third lumbar vertebra (L3) level.
A: Axial computed tomography (CT) image showing the segmentation of different tissue compartments: Skeletal muscle area (SMA) [pink, -29 to +150 Hounsfield units (HU)], visceral adipose tissue area (light blue, -150 to -50 HU), subcutaneous adipose tissue area (dark blue, -190 to -30 HU), and intermuscular adipose tissue area (orange, -190 to -30 HU); B: Sagittal CT image indicating the L3 level for axial analysis. The skeletal muscle index was calculated as the SMA divided by the square of the patient’s height (SMA/height2).
- Citation: Yang KZ, Chen L, Xu L, Xu BX, Li MY, Wang Z, Lu Q. Correlation between sarcopenia and esophageal stenosis following endoscopic submucosal dissection and construction of a postoperative stenosis risk model. World J Gastroenterol 2026; 32(5): 114752
- URL: https://www.wjgnet.com/1007-9327/full/v32/i5/114752.htm
- DOI: https://dx.doi.org/10.3748/wjg.v32.i5.114752