
















Copyright: ©Author(s) 2026.
World J Gastroenterol. Dec 28, 2026; 32(48): 123033
Published online Dec 28, 2026. doi: 10.3748/wjg.123033
Published online Dec 28, 2026. doi: 10.3748/wjg.123033
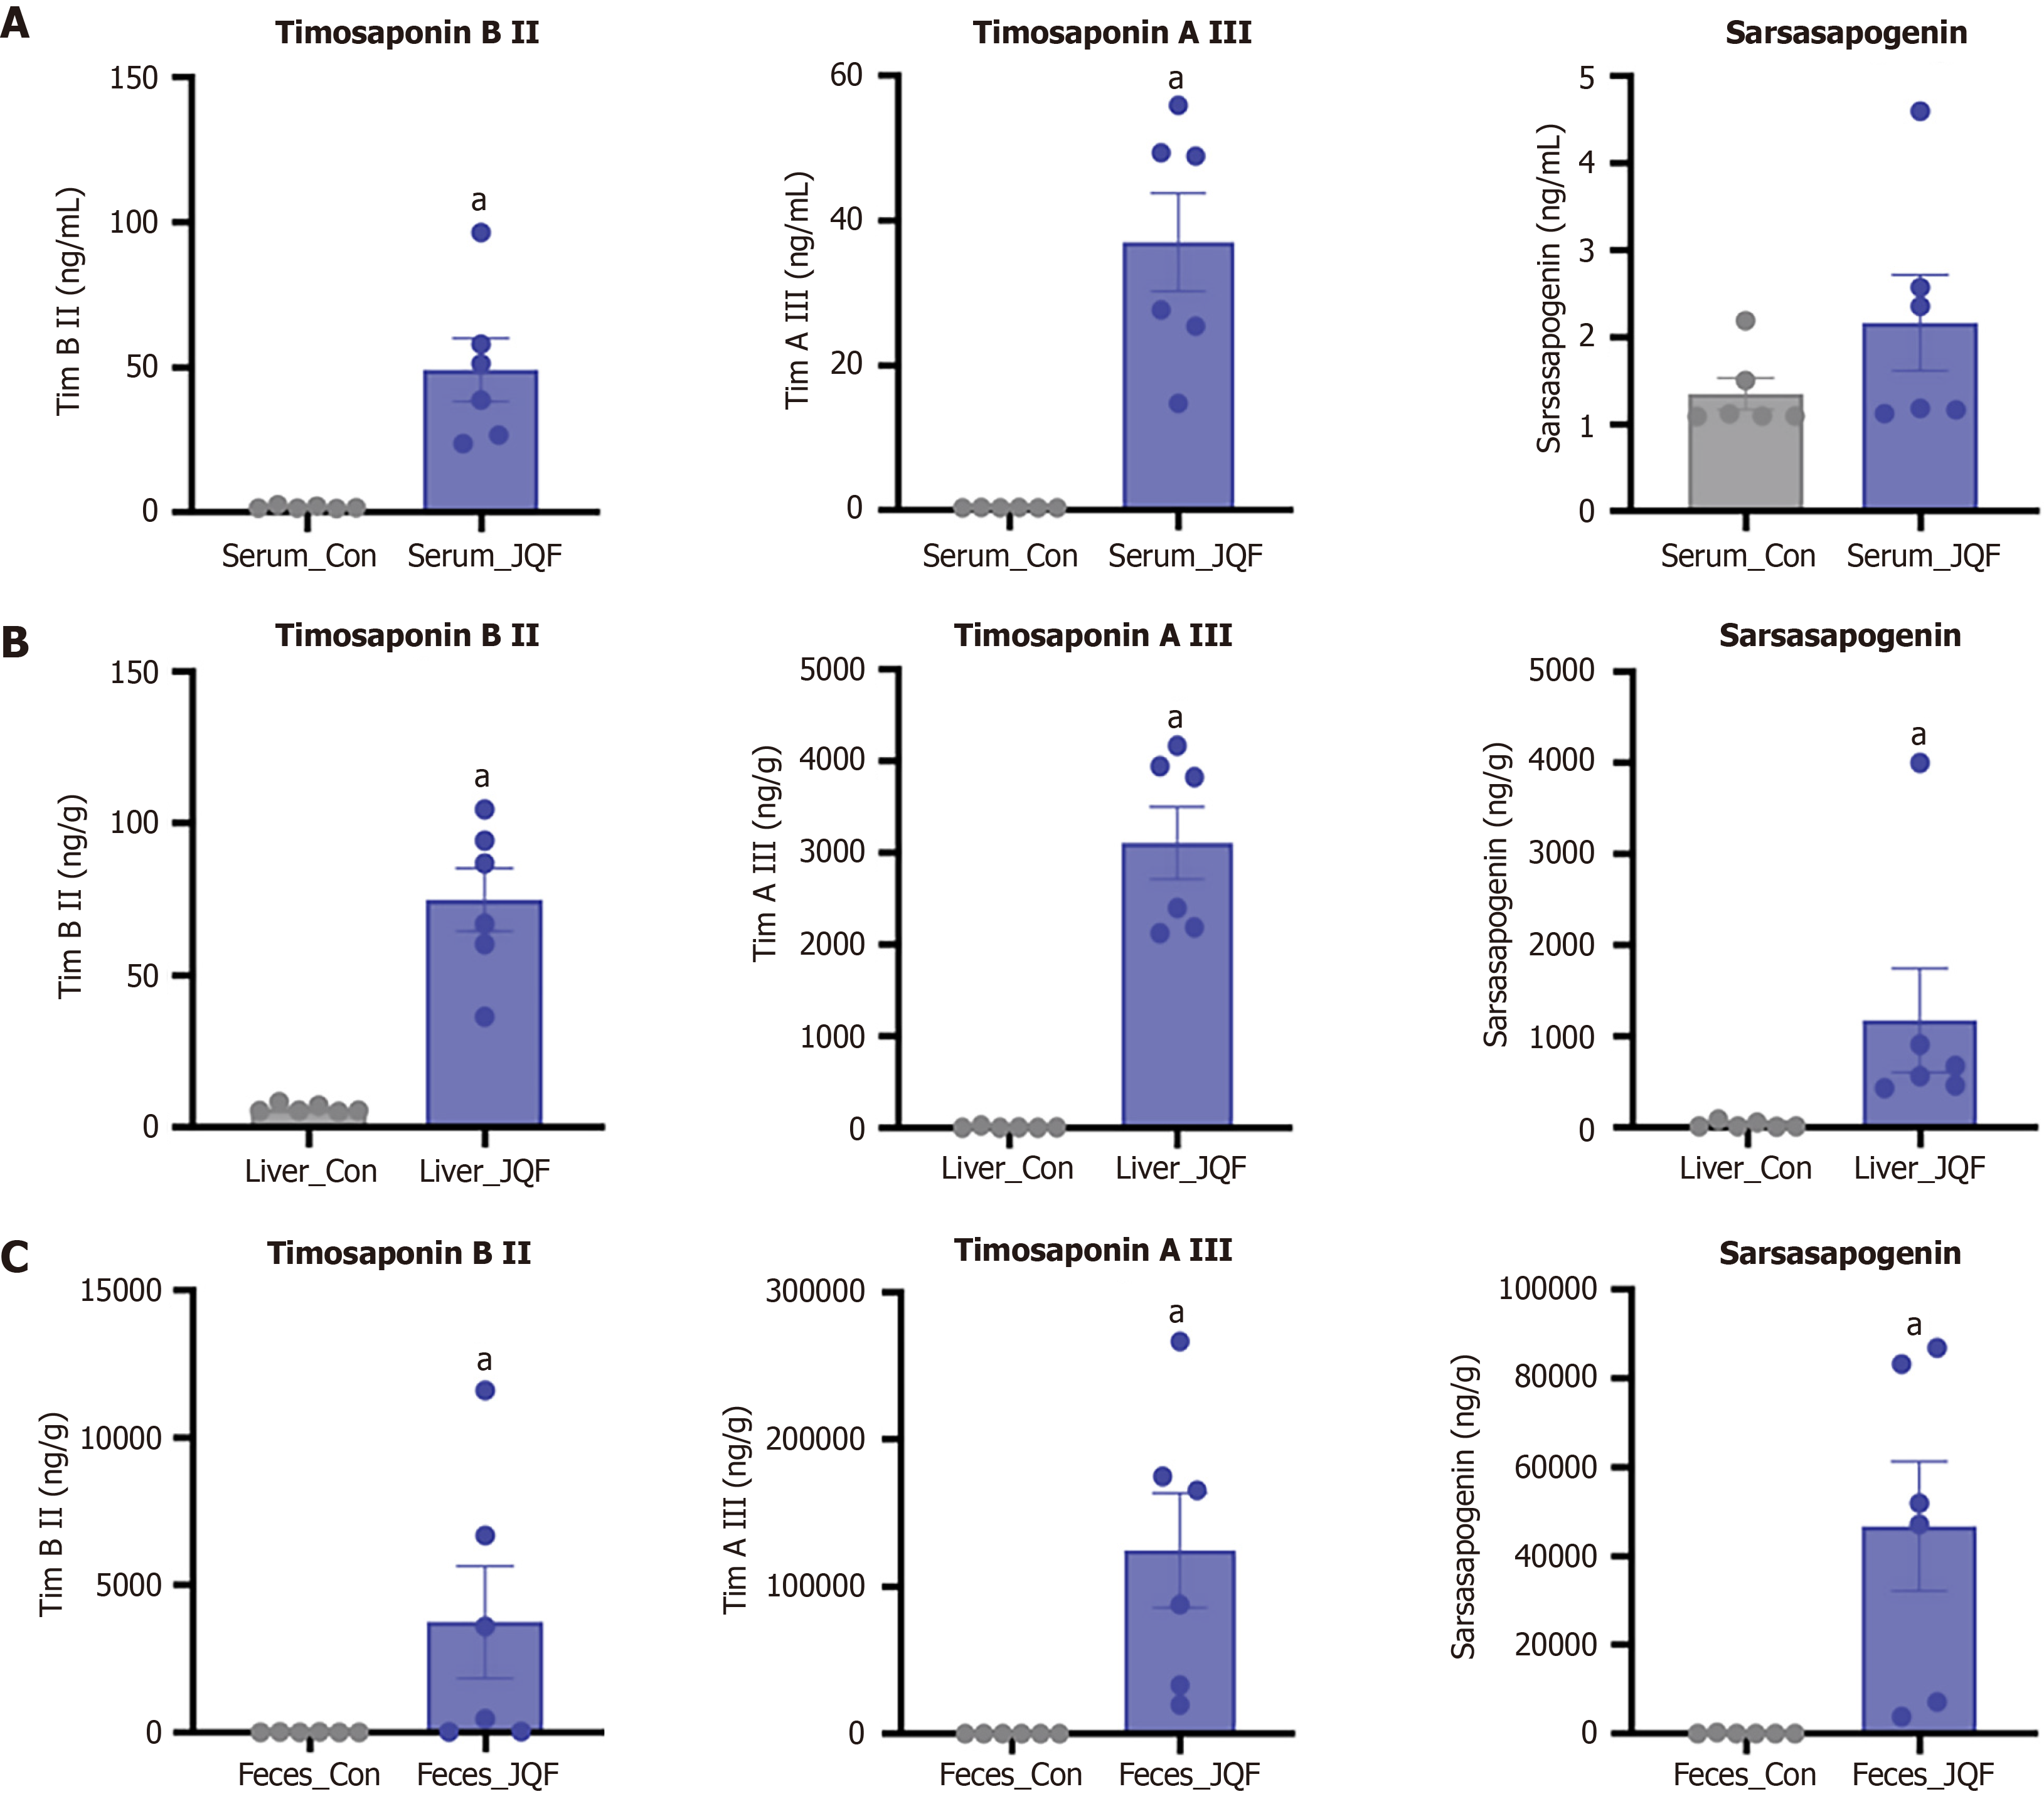
Figure 8 Targeted metabolomic analysis of timosaponin B II, timosaponin A III, and sarsasapogenin (n = 6).
A: Serum levels; B: Hepatic levels; C: Fecal levels. aP < 0.01 vs control group. Con: Control; JQF: Jiangtang Qingre formula.
- Citation: Zhou LJ, Wu JL, Wang H, Han R, Tang C, Fang F, Zhu DP. Integrating proteomics, metabolomics, and molecular docking to elucidate the mechanism of Jiangtang Qingre formula against metabolic dysfunction-associated steatohepatitis. World J Gastroenterol 2026; 32(48): 123033
- URL: https://www.wjgnet.com/1007-9327/full/v32/i48/123033.htm
- DOI: https://dx.doi.org/10.3748/wjg.123033