
















Copyright: ©Author(s) 2026.
World J Gastroenterol. Dec 28, 2026; 32(48): 122612
Published online Dec 28, 2026. doi: 10.3748/wjg.122612
Published online Dec 28, 2026. doi: 10.3748/wjg.122612
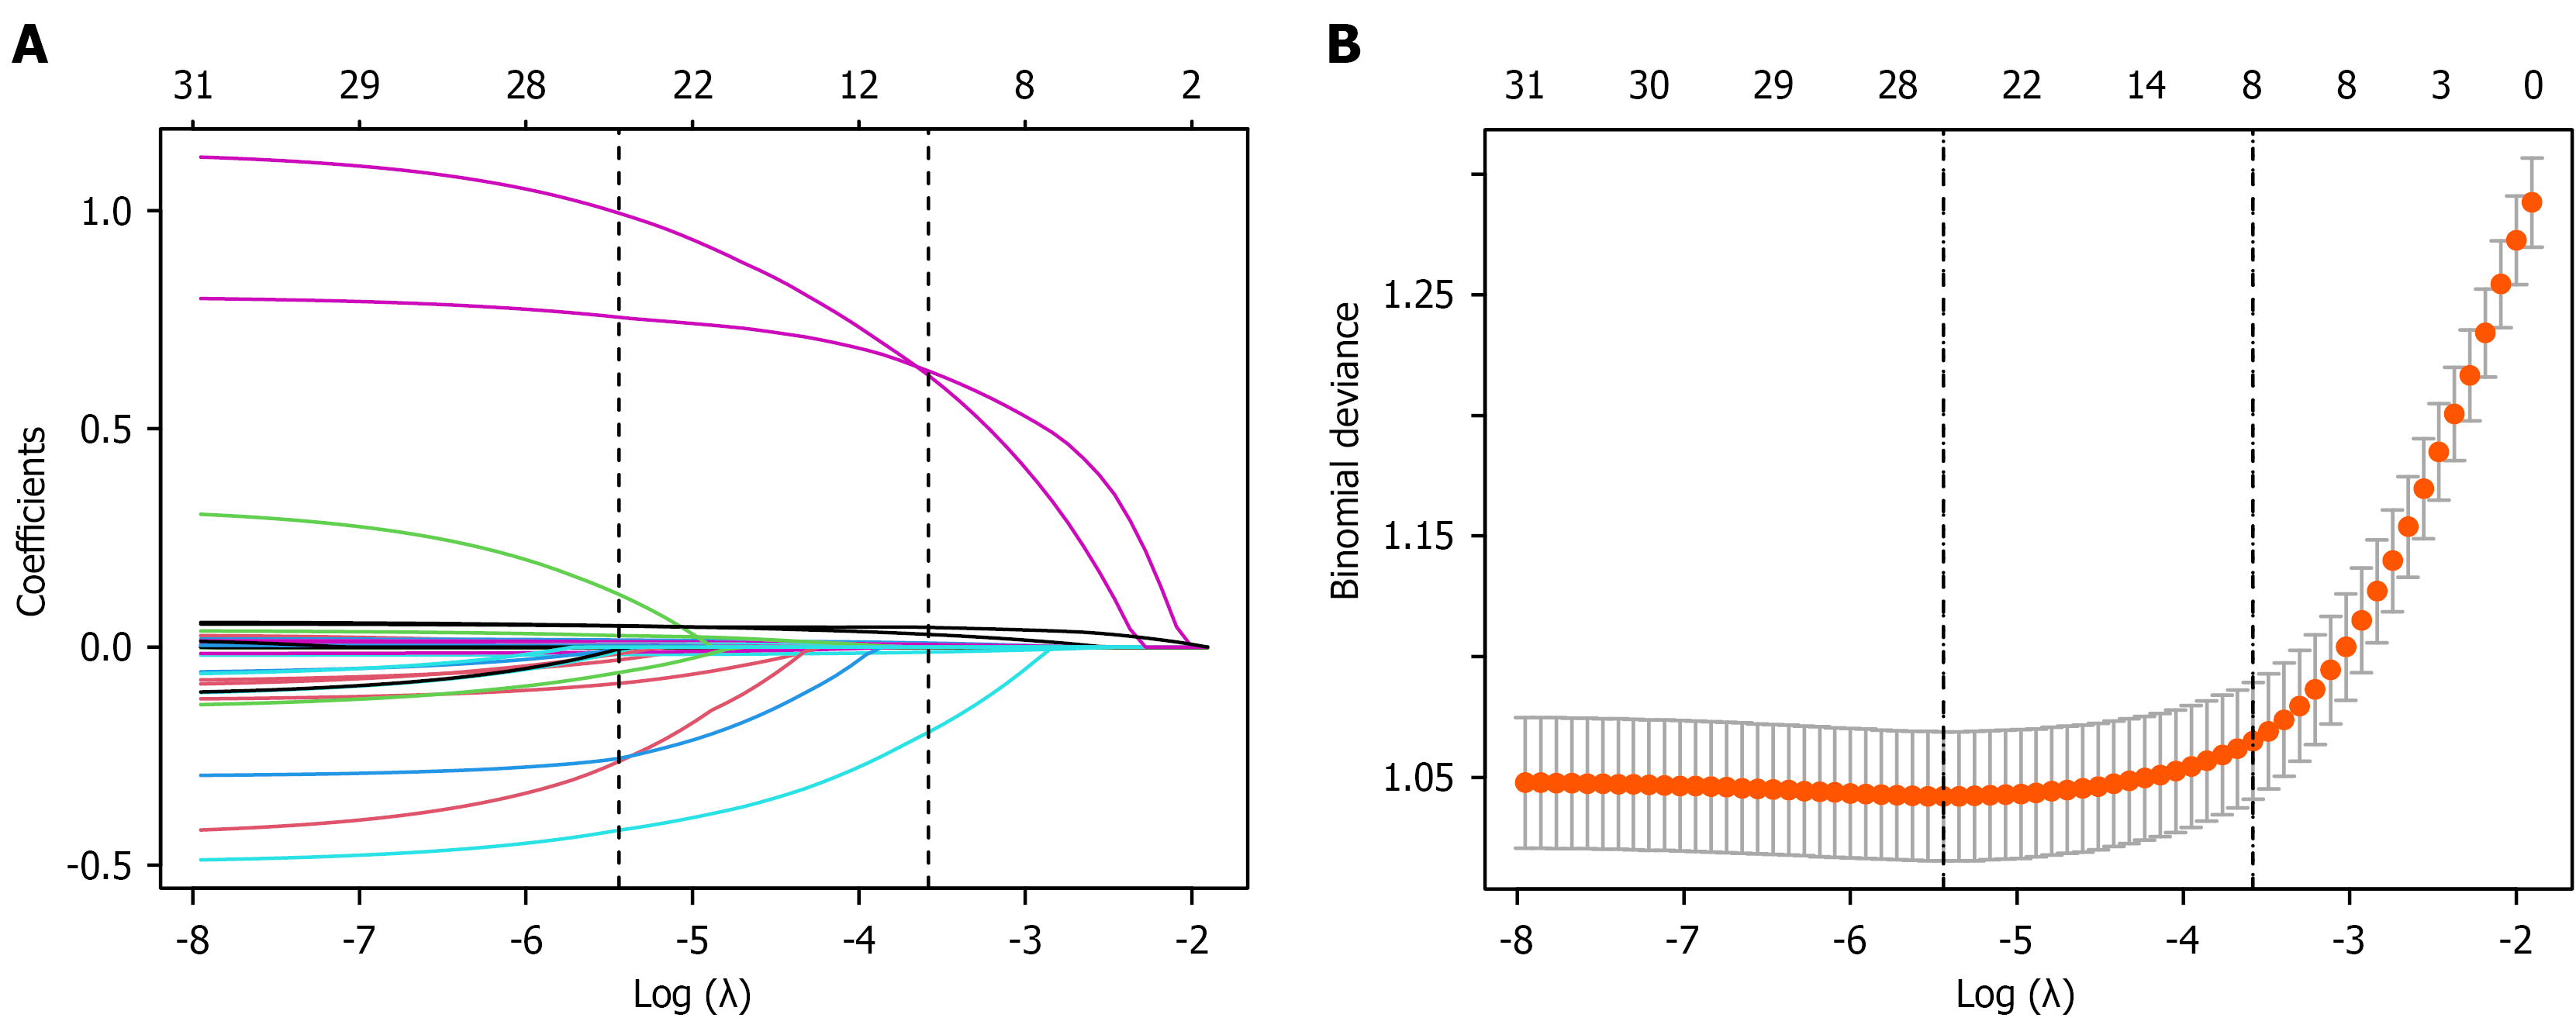
Figure 1 Predictor selection using the least absolute shrinkage and selection operator regression method.
A: Coefficient profile plot showing the trajectories of predictor coefficients across the log (λ) sequence. The dotted vertical lines indicate the optimal λ values selected according to the minimum criterion and the one-standard-error (1-SE) criterion. Predictors included in the final model were selected based on the 1-SE criterion; B: Ten-fold cross-validation plot used to determine the optimal tuning parameter (λ) in the least absolute shrinkage and selection operator model. The dotted vertical lines represent the λ values corresponding to the minimum criterion and the 1-SE criterion.
- Citation: Wang N, Tan YW, Zhang PF, Zhou XB, Zhu L. CLIF-AKI score predicts KDIGO stage 3 acute kidney injury in intensive care unit patients with acute-on-chronic liver failure. World J Gastroenterol 2026; 32(48): 122612
- URL: https://www.wjgnet.com/1007-9327/full/v32/i48/122612.htm
- DOI: https://dx.doi.org/10.3748/wjg.122612